Cisco IP SLA IOS-XE
Cisco IP Service Level Agreements (SLAs) is a proprietary feature available on Cisco routers and switches, which actively generates monitoring traffic, processes replies, and measures network performance.
This feature can be used to perform continuous end-to-end connectivity testing with automated re-routing over failover links. It can also simulate different application behavior, such as voice and video to check if the network provides the expected level of service.
The examples and features described in this article are based on Cisco IOS-XE version 16.9.
Configuration Components
IP SLA configuration starts with defining an SLA operation and then scheduling it to run immediately or at a specific time.
SLA Operation Definition
To create or edit an SLA operation use the “ip sla <operation-id>” global configuration mode command. It places CLI into the IP SLA configuration sub-mode, where you can select one of the IP SLA types and provide corresponding configuration parameters.
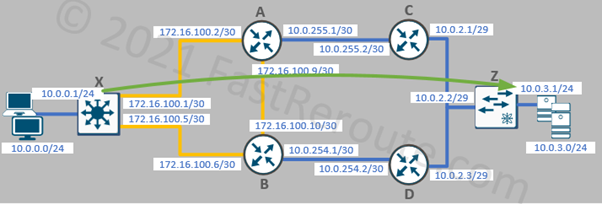
One of the simplest types of IP SLA operations is icmp-echo. The router pings a specified IP address and records round-trip times if the remote side is reachable. In the example below, we will set the type of SLA entry as ICMP echo with the destination’s IP address of 10.0.3.1. The sample topology is shown in Figure 1.
X(config)#ip sla 1
X(config-ip-sla)# icmp-echo 10.0.3.1 source-ip 10.0.0.1
X(config-ip-sla-echo)#?
IP SLAs Icmp Echo Configuration Commands:
  data-pattern       Data Pattern
  default            Set a command to its defaults
  exit               Exit operation configuration
  frequency          Frequency of an operation
  history            History and Distribution Data
  no                 Negate a command or set its defaults
  owner              Owner of Entry
  request-data-size  Request data size
  tag                User defined tag
  threshold          Operation threshold in milliseconds
  timeout            Timeout of an operation
  tos                Type Of Service
  verify-data        Verify data
  vrf                Configure IP SLAs for a VRF
Scheduling IP SLA
Once SLA is defined and optional parameters are specified, start it by running the “ip sla schedule <id>” command. IP SLA can be configured to start at a specific time or as soon as the command is entered, which is shown in the example below.
X(config)#ip sla schedule 1 start-time now life forever
To check SLA operation’s details use the “show ip sla statistics
X#show ip sla statistics 1 details
IPSLAs Latest Operation Statistics
IPSLA operation id: 1
        Latest RTT: 1 milliseconds
Latest operation start time: 10:08:18 UTC Sat Jan 30 2021
Latest operation return code: OK
Over thresholds occurred: FALSE
Number of successes: 2
Number of failures: 0
Operation time to live: Forever
Operational state of entry: Active
Last time this entry was reset: Never
To see configuration details, including default values for various parameters, use the “show ip sla configuration” command.
X#show ip sla configuration
IP SLAs Infrastructure Engine-III
Entry number: 1
Owner:
Tag:
Operation timeout (milliseconds): 5000
Type of operation to perform: icmp-echo
Target address/Source address: 10.0.3.1/10.0.0.1
Type Of Service parameter: 0x0
Request size (ARR data portion): 28
Data pattern: 0xABCDABCD
Verify data: No
Vrf Name:
Schedule:
   Operation frequency (seconds): 60  (not considered if randomly scheduled)
   Next Scheduled Start Time: Start Time already passed
   Group Scheduled : FALSE
   Randomly Scheduled : FALSE
   Life (seconds): Forever
   Entry Ageout (seconds): never
   Recurring (Starting Everyday): FALSE
   Status of entry (SNMP RowStatus): Active
Threshold (milliseconds): 5000
Distribution Statistics:
   Number of statistic hours kept: 2
   Number of statistic distribution buckets kept: 1
   Statistic distribution interval (milliseconds): 20
Enhanced History:
History Statistics:
   Number of history Lives kept: 0
   Number of history Buckets kept: 15
   History Filter Type: None
Once SLA operation is scheduled, it cannot be modified. Instead, the old operation can be deleted, and then a new one created again using the same ID.
Different IP SLA Types
To view available types of SLA operations, use context-sensitive help as shown in the next example.
X(config-ip-sla)#?
IP SLAs entry configuration commands:
  dhcp         DHCP Operation
  dns          DNS Query Operation
  ethernet     Ethernet Operations
  exit         Exit Operation Configuration
  ftp          FTP Operation
  http         HTTP Operation
  icmp-echo    ICMP Echo Operation
  icmp-jitter  ICMP Jitter Operation
  mpls         MPLS Operation
  path-echo    Path Discovered ICMP Echo Operation
  path-jitter  Path Discovered ICMP Jitter Operation
  tcp-connect  TCP Connect Operation
  udp-echo     UDP Echo Operation
  udp-jitter   UDP Jitter Operation
The next subsections will review some of them.
Jitter operations
Jitter is a variation in the delay between packets. The smaller the jitter the better performance of time-sensitive applications such as voice. It also means that the network delivers packets with a predictable delay and doesn’t experience congestions causing intermittent delays along the paths.
There are 2 types of SLA operations performing Jitter measurements – ICMP and UDP-based.
ICMP Jitter
ICMP Jitter SLA operation is based on ICMP message types (Timestamp Request and Timestamp Reply). The destination can be any device that supports these ICMP messages. Not all devices support it, or it can be blocked by the firewalls. The previously shown ICMP Echo operation is based on more commonly used Echo and Reply message types.
The configuration in the example below demonstrates how to configure ICMP jitter operation and, that once launched, it reports the round-trip-time (RTT) and jitter statistics from the source to the destination, and vice versa.
X(config)# ip sla 2
X(config-ip-sla)# icmp-jitter 10.0.3.1 source-ip 10.0.0.1
X(config)# ip sla schedule 2 start-time now life forever
X#show ip sla statistics 2
IPSLAs Latest Operation Statistics
IPSLA operation id: 2
Type of operation: icmp-jitter
        Latest RTT: 1 milliseconds
Latest operation start time: 00:20:39 UTC Sun Jan 31 2021
Latest operation return code: OK
RTT Values:
        Number Of RTT: 10               RTT Min/Avg/Max: 1/1/1 milliseconds
Latency one-way time:
        Number of Latency one-way Samples: 0
        Source to Destination Latency one way Min/Avg/Max: 0/0/0 milliseconds
        Destination to Source Latency one way Min/Avg/Max: 0/0/0 milliseconds
Jitter Time:
        Number of SD Jitter Samples: 9
        Number of DS Jitter Samples: 9
        Source to Destination Jitter Min/Avg/Max: 0/1/1 milliseconds
        Destination to Source Jitter Min/Avg/Max: 0/1/1 milliseconds
Over Threshold:
        Number Of RTT Over Threshold: 0 (0%)
Packet Late Arrival: 0
Out Of Sequence: 0
        Source to Destination: 0        Destination to Source 0
        In both Directions: 0
Packet Skipped: 0       Packet Unprocessed: 0
Packet Loss: 0
        Loss Periods Number: 0
        Loss Period Length Min/Max: 0/0
        Inter Loss Period Length Min/Max: 0/0
Number of successes: 4
Number of failures: 0
Operation time to live: Forever
To measure jitter, a source router sends a number of packets (10, by default) periodically. The time between these packets is called interval (20ms). The operation is repeated at a specified frequency (60 seconds by default).
The example below shows default configuration values – every 60 seconds the router will send 10 packets with 20 milliseconds interval between each packet.
X#show ip sla configuration 2
IP SLAs Infrastructure Engine-III
Entry number: 2
Owner:
Tag:
Operation timeout (milliseconds): 5000
Type of operation to perform: icmp-jitter
Target address/Source address: 10.0.3.1/10.0.0.1
Packet Interval (milliseconds)/Number of packets: 20/10
Type Of Service parameter: 0x0
Vrf Name:
Schedule:
   Operation frequency (seconds): 60  (not considered if randomly scheduled)
<output is truncated>
UDP Jitter and IP SLA responder
UDP is used in voice and video communications. Using UDP traffic for measurements suits better to simulate such applications. In an IP SLA operation configuration codec type can be specified, and this will define packet size and enable various voice-specific metric calculations, such as Mean Opinion Score (MOS).
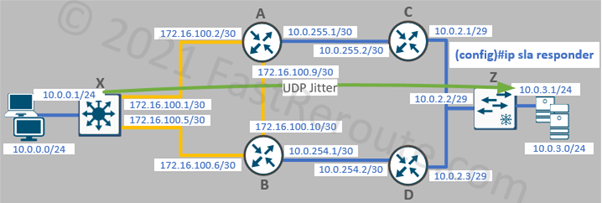
To use the UDP Jitter destination device must also be a Cisco device with an IP SLA responder feature enabled on it. The responder’s basic configuration is completed with the single command on router Z:
Z(config)#ip sla responder
Back on the router X, IP SLA configuration is done per the example below.
X(config)#ip sla 3
X(config-ip-sla)#udp-jitter 10.0.3.1 2345 source-ip 10.0.0.1
X(config)#ip sla schedule 3 start-time now life forever
X#show ip sla statistics
IPSLAs Latest Operation Statistics
IPSLA operation id: 3
Type of operation: udp-jitter
        Latest RTT: 1 milliseconds
Latest operation start time: 05:53:56 UTC Sun Jan 31 2021
Latest operation return code: OK
RTT Values:
        Number Of RTT: 10               RTT Min/Avg/Max: 1/1/1 milliseconds
Latency one-way time:
        Number of Latency one-way Samples: 0
        Source to Destination Latency one way Min/Avg/Max: 0/0/0 milliseconds
        Destination to Source Latency one way Min/Avg/Max: 0/0/0 milliseconds
Jitter Time:
        Number of SD Jitter Samples: 9
        Number of DS Jitter Samples: 9
        Source to Destination Jitter Min/Avg/Max: 0/1/1 milliseconds
        Destination to Source Jitter Min/Avg/Max: 0/1/1 milliseconds
Over Threshold:
        Number Of RTT Over Threshold: 0 (0%)
Packet Loss Values:
        Loss Source to Destination: 0
        Source to Destination Loss Periods Number: 0
        Source to Destination Loss Period Length Min/Max: 0/0
        Source to Destination Inter Loss Period Length Min/Max: 0/0
        Loss Destination to Source: 0
        Destination to Source Loss Periods Number: 0
        Destination to Source Loss Period Length Min/Max: 0/0
        Destination to Source Inter Loss Period Length Min/Max: 0/0
        Out Of Sequence: 0      Tail Drop: 0
        Packet Late Arrival: 0  Packet Skipped: 0
Voice Score Values:
        Calculated Planning Impairment Factor (ICPIF): 0
        Mean Opinion Score (MOS): 0
Number of successes: 1
Number of failures: 0
Operation time to live: Forever
Path operations
When measuring latency between two hosts it is useful to know how much delay is contributed by each hop along the path. Path-type SLAs work by running traceroute first and then performing echo or jitter operation against each discovered hop.
X(config)#ip sla 4
X(config-ip-sla)#path-echo 10.0.3.1 source-ip 10.0.0.1
X(config)#ip sla schedule 4 start-time now life forever
The configuration is based on the same network topology with 2 paths available to the destination.
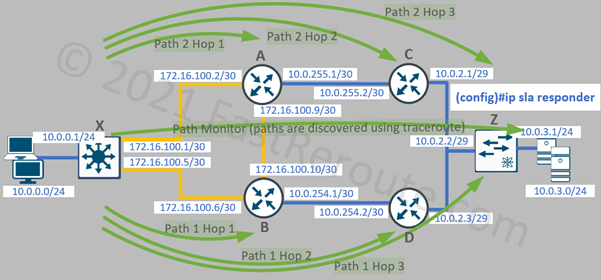
The “show ip sla statistics aggregated 4 details” command will display round-trip time statistics for each hop. For example, the command output below shows statistics for the first hop in the path going via router B. The remaining hops statistics are omitted in the example below.
X#show ip sla statistics aggregated 4 details
IPSLAs aggregated statistics

Distribution Statistics:
Bucket Range: 0 to < 20 ms
Avg. Latency: 1 ms
Percent of Total Completions for this Range: 100 %
Number of Completions/Sum of Latency: 1/1
Sum of RTT squared low 32 Bits/Sum of RTT squared high 32 Bits: 1/0
Operations completed over threshold: 0
Start Time Index: *09:54:47.234 UTC Tue Feb 2 2021
Path Index: 3
Hop in Path Index: 1
Type of operation: path-echo
Number of successes: 18
Number of failures: 0
Number of over thresholds: 0
Failed Operations due to Disconnect/TimeOut/Busy/No Connection: 0/0/0/0
Failed Operations due to Internal/Sequence/Verify Error: 0/0/0
Failed Operations due to Control enable/Stats retrieve Error: 0/0
Target Address 172.16.100.6
<output is truncated>
Other operations
IP SLA can perform application-specific monitoring, for example, it can run HTTP or FTP operations against a remote server. For generic TCP applications, TCP operation can be used, which validates if the TCP connection can be established and how long it takes to connect to the server.
The other available operation types are DHCP (checks how long it takes to obtain an IP address) and DNS queries.
Reactions and Proactive Monitoring
In the previous sections, we’ve reviewed different types of SLA operations and how to check their operations using CLI. By using SNMP-based monitoring software, administrators can poll SLA data from routers periodically, which is a more scalable approach to monitoring. Cisco provides SNMP MIB called RTTMON that provides access to IP SLAs from monitoring software.
It is also possible for a router to send an SNMP trap or Syslog message if a certain event happens. IP SLA includes a feature called proactive threshold monitoring. To enable it IP SLA reaction must be configured.
SLA reaction configuration command references an IP SLA operation and has a mandatory parameter specifying what monitored element of SLA we want to monitor. For example, this can be a timeout or threshold-based value. Available monitored elements vary based on the type of IP SLA operation. A compatibility table is available on this page. https://www.cisco.com/c/en/us/td/docs/ios-xml/ios/ipsla/configuration/xe-16-9/sla-xe-16-9-book/sla-threshold-mon.html
The example below uses a previously configured IP SLA operation of icmp-echo type.
ip sla 1
 icmp-echo 10.0.3.1 source-ip 10.0.0.1
ip sla schedule 1 life forever start-time now
The reaction configuration below references SLA operation 1 and selects timeout as a monitored element. Then we enable simple SNMP configuration to send a trap when operations times out.
X(config)#ip sla reaction-configuration 1 react timeout action-type trapOnly threshold-type immediate
X(config)#snmp-server enable traps ipsla
X(config)#snmp-server host 10.0.0.5 PUBLIC
To test it, I’ve turned off the interface on router Z and enabled debug of SNMP packets to confirm that SNMP traps were generated by the router.
X#debug snmp packets
*Feb  4 09:41:49.232: SNMP: Queuing packet to 10.0.0.5
*Feb  4 09:41:49.232: SNMP: V1 Trap, ent rttMonNotificationsPrefix, addr 10.0.0.1, gentrap 6, spectrap 2
 rttMonCtrlAdminTag.1 =
 rttMonHistoryCollectionAddress.1 = 0A 00  03 01
 rttMonCtrlOperTimeoutOccurred.1 = 2
<output is truncated>
Enhanced Object Tracking
The final section of this document addresses how a router can change its data plane operation in response to IP SLA operational status.
The feature responsible for translating the status of IP SLA operations to the data plane protocols is called Enhanced Object Tracking. First-Hop Redundancy Protocols, such as HSRP and VRRP use the tracking objects to take over or release data forwarding roles. Static and policy-based routing can also use the tracking objects to re-route around degraded paths.
EEM (Embedded Event Manager) scripts can monitor tracking object’s status changes. This makes it possible to run powerful EEM scripting in response to track status change.
A Track object can have 2 states – Up and Down. IP SLA operations can have several return codes. For the purpose of object tracking, we are interested in the 3 return codes discussed below. All other codes that are not covered in this article translate into the Down state of the Track object.
Let’s re-use the IP SLA ICMP Echo operation from the previous example and check the code of the operation. The second command in the listing shows how to check the default threshold (5000ms):
X#show ip sla statistics 1 | incl code
Latest operation return code: OK
X#show ip sla configuration 1 | include Threshold
Threshold (milliseconds): 5000
The operation’s return code is OK, which means that the ping operation is successful and its round-trip time is within the threshold (in our network it is 1ms). OK status always translates to the UP state of the corresponding track object.
If we will turn off the remote interface on router Z, the return code will change to Timeout, as per the listing below. This is the second SLA operation code, which always translates into the Down state of the Track object.
X#show ip sla statistics 1 | incl code
Latest operation return code: Timeout
The third code that is relevant for the purpose of track operation is OverThreshold. To demonstrate it, we increased the request data size to 5000 bytes, so the operation takes longer than 1ms. We also decreased the threshold to 1ms, so the operation goes over the threshold.
The OverThreshold code translates differently to the track object state, which we will discuss in the next section.
X(config)#ip sla 2
X(config-ip-sla)#icmp-echo 10.0.3.1 source-ip 10.0.0.1
X(config-ip-sla-echo)# request-data-size 5000
X(config-ip-sla-echo)# threshold 1
X(config)#ip sla schedule 2 start-time now life forever
X#show ip sla statistics 2
IPSLAs Latest Operation Statistics
IPSLA operation id: 2
        Latest RTT: 2 milliseconds
Latest operation start time: 09:44:48 UTC Sat Feb 6 2021
Latest operation return code: Over threshold
Number of successes: 2
Number of failures: 0
Operation time to live: Forever
IP SLA Track State vs. Reachability
“track <id> ip sla <sla-id>” command creates a track object that references SLA operation. There are 2 types of track objects for SLA – reachability, and state. Let’s configure both types against the previously configured SLA 2 to see the difference.
X(config)#track 1 ip sla 2 reachability
X(config)#track 2 ip sla 2 state
X#show track
Track 1
  IP SLA 2 reachability
  Reachability is Up
    1 change, last change 00:00:29
  Latest operation return code: Over threshold
  Latest RTT (millisecs) 2
Track 2
  IP SLA 2 state
  State is Down
    1 change, last change 00:00:17
  Latest operation return code: Over threshold
  Latest RTT (millisecs) 2
Track 1 is based on reachability and it is UP, even when the underlying IP SLA object is over the threshold. As the name suggests, we only interested in the fact that we can reach the remote side of the connection. Track 2 is state-based and it returns DOWN for the same IP SLA object. Track of the state type checks both reachability and that the IP SLA object is under the specified threshold.
Static Routes
The next listing demonstrates how to use the track objects with static routes:
X(config)#ip route 0.0.0.0 0.0.0.0 172.16.100.2 track 1 200
X(config)#ip route 0.0.0.0 0.0.0.0 172.16.100.6 track 2
X#sh ip route 0.0.0.0
Routing entry for 0.0.0.0/0, supernet
  Known via "static", distance 200, metric 0, candidate default path
  Routing Descriptor Blocks:
  * 172.16.100.2
      Route metric is 0, traffic share count is 1
The route via 172.16.100.6 is the preferred, as it has the default administrative distance of 1. The route via 172.16.100.2 is a backup route with an administrative distance of 200. However, the route table shows that the router prefers the route via 172.16.100.2.
For a route to be installed into the routing table the corresponding track must be UP. Because track object #2 is Down, the static route via 172.16.100.6 is withdrawn and the backup route is chosen and installed into the routing table.
EEM Scripts with IP SLA
The final example of this article is an EEM (Embedded Event Manager) script that adjusts the router configuration, generates a Syslog message in response to the Track state change.
The script is triggered when Track object #1 goes down, with the “event track <object-id> state down” command.
The access-list is being adjusted by the script in this example only for demonstration purposes. It can be adjusted to suit real-life requirements. For example, the script can reconfigure VPN tunnel endpoints or enable a backup interface. EEM can perform many other non-CLI actions as well.
X(config)#event manager applet TRACK-1-DOWN
X(config-applet)#event track 1 state down
X(config-applet)#action 1 cli command "enable"
X(config-applet)#action 2 cli command "conf t"
X(config-applet)#action 3 cli command "ip access-list extended INTERNET-IN"
X(config-applet)#action 4 cli command "permit ip host 1.2.3.4 any"
X(config-applet)#action 5 syslog msg "TEST Message"
X#show run | section ^ip access-list
<none>
To test the script, I’ve turned off the remote interface on router Z causing IP SLA and track to go down. The router generates a test Syslog message and creates an access-list, as shown in the listing below. “terminal monitor” command displays console messages into VTY lines, such as SSH or Telnet.
X#terminal monitor
*Feb  6 10:13:50.285: %TRACK-6-STATE: 1 ip sla 2 reachability Up -> Down
*Feb  6 10:13:50.530: %HA_EM-6-LOG: TRACK-1-DOWN: TEST Message
X#sh run | section ^ip access-list
ip access-list extended INTERNET-IN
 permit ip host 1.2.3.4 any