Cisco SD-WAN Packet Capture
Packet capture provides a way of getting a copy of the packets traversing a router. This can be useful for troubleshooting purposes when you want to see if the packets are being received or sent by the router via the expected interface.
There are 2 ways to perform the packet capture – one is using the vManage user interface, and another one is using CLI directly on the router. In this article, we will explain how to use both of them.
Using vManage
Packet capture is reachable via the Device Troubleshooting page – Monitor > Network > Device name > Troubleshooting. By default, there is no Packet Capture option under the Traffic section, as shown in Figure 1.
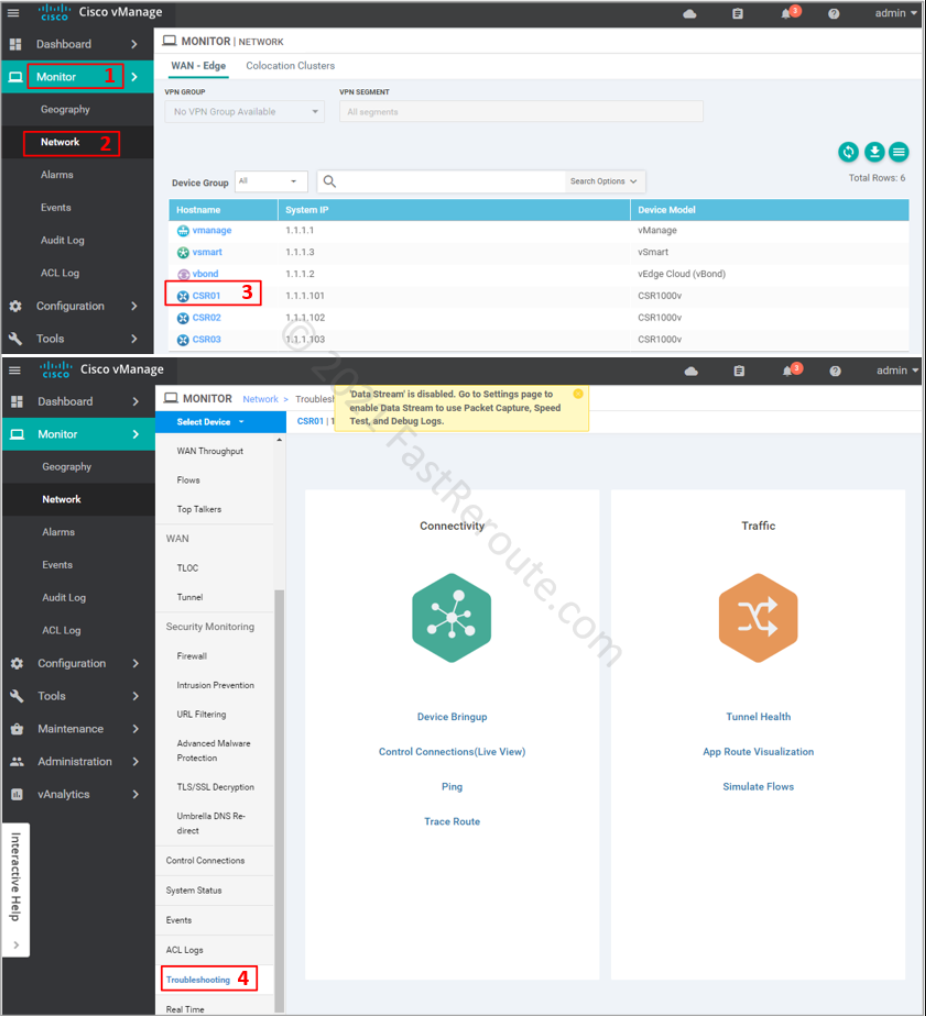
The pop-up alert displays: “Data Stream is disabled. Go to the Settings page to enable Data Stream to use Packet Capture, Speed Test, and Debug Logs”. To run packet captures via vManage we must enable Data Stream.
Navigate to Administration > Settings. Then expand the Data Stream option, as shown in the screenshot below. Click on the “Enabled” radio box, type in the hostname, which is the name or IP address of vManage and VPN that the edge router should use to reach the controller.
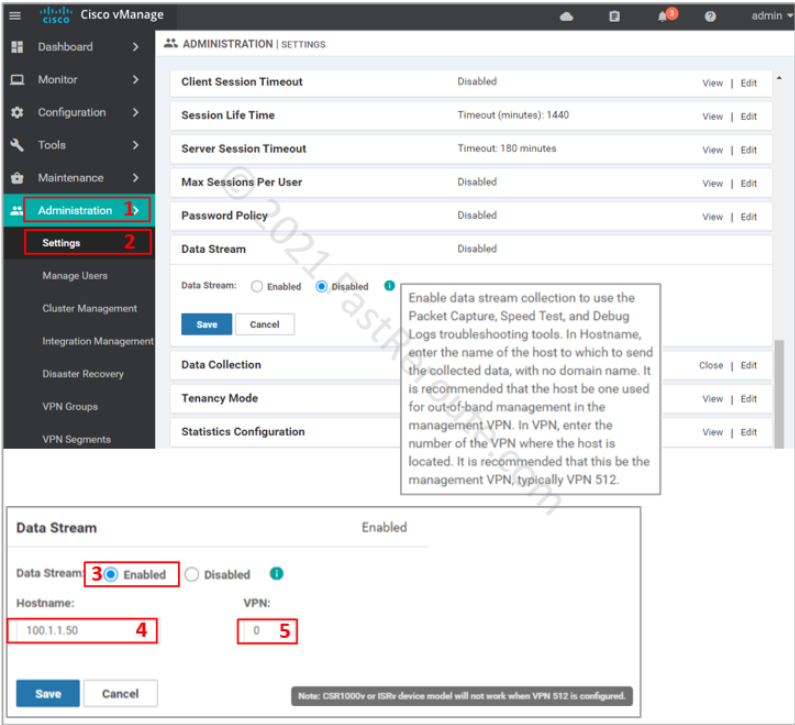
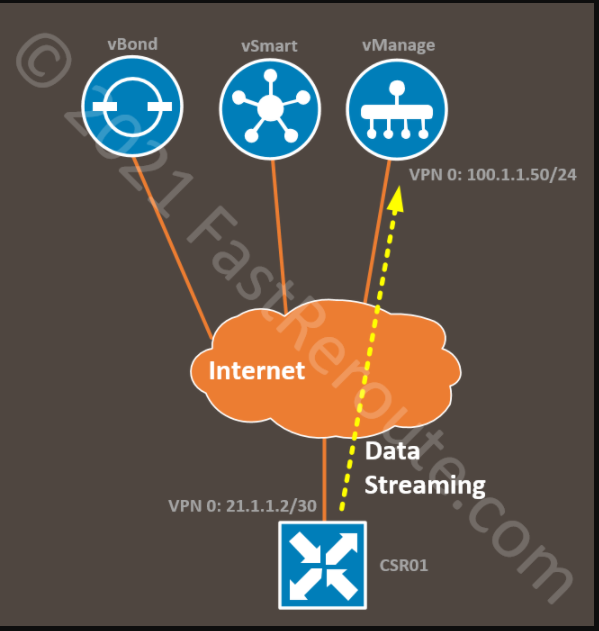
Note that for virtualized platforms, like the one we use for the lab, VPN 512 (out-of-band) cannot be used. To make this work, we are using the public IP of vManage, which is reachable via transport VPN 0. Our lab topology is shown in the figure below.
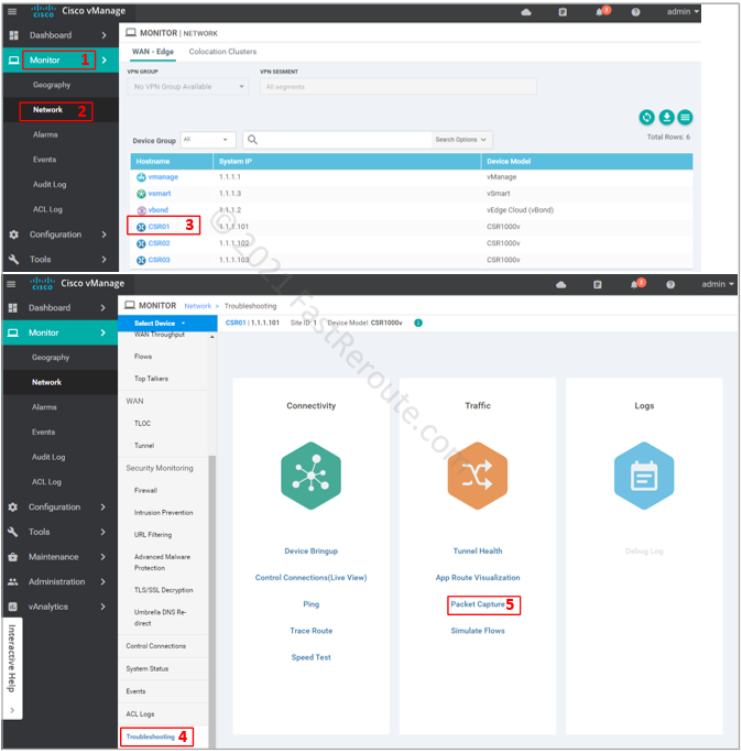
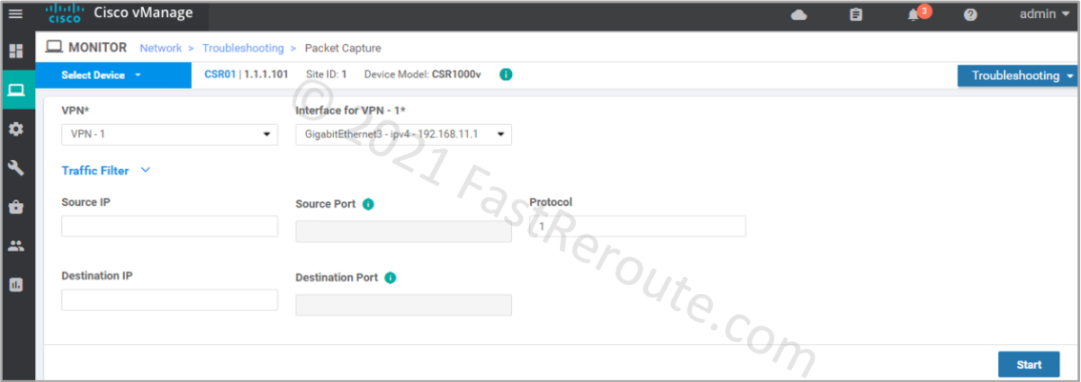
After enabling Data Streaming, the Packet Capture option is now visible in the Troubleshooting section. After clicking on this option, we can define packet capture parameters.
Packet capture screen requires VPN and Interface filter selection. You can optionally provide other filters, such as source and destination IPs and protocol information. Traffic is captured in both ingress and egress directions. Let’s change the filter to protocol 1 (ICMP) and start capture by pressing the Start button.
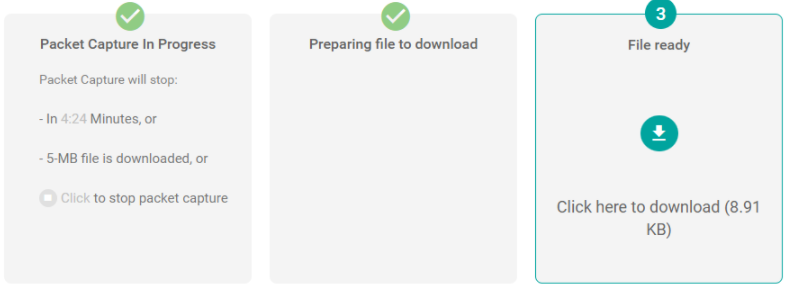
By default, the capture will run for 5 minutes. You can stop the timer at any time to download packets captured so far. The file in pcap format will be available for download shortly.
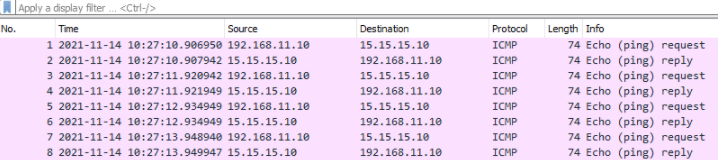
The content of the file can be viewed in Wireshark, as shown below.
CSR01#show monitor capture
Status Information for Capture 71f87e76_847e_4770_8289_56b5242ac115
  Target Type:
 Interface: GigabitEthernet3, Direction: BOTH
   Status : Active
  Filter Details:
   IPv4
    Source IP:  any
    Destination IP:  any
   Protocol: 1
  Buffer Details:
   Buffer Type: LINEAR (default)
   Buffer Size (in MB): 5
  Limit Details:
   Number of Packets to capture: 0 (no limit)
   Packet Capture duration: 300
   Packet Size to capture: 0 (no limit)
   Maximum number of packets to capture per second: 1000
   Packet sampling rate: 0 (no sampling)
Using CLI on the router
If for some reason you can’t use vManage, you can use IOS-XE Embedded Packet Capture directly on the device (the previous process uses this feature on the backend). Use SSH to connect to the device either via client installed on your computer or via the tools menu in vManage.
The next configuration commands provide an example of running packet capture.
Embedded packet capture commands begin with monitor capture commands. They are available in exec mode, other operational commands, like “show” and “debug”.
CSR01#monitor capture ?
  WORD   Name of the Capture
  clear  Clear all Buffers
  start  Enable all capture points
  stop   Disable all capture points
Specify a name for the packet capture instance, in our example it is TEST_CAPTURE. The available command options are shown below.
CSR01#monitor capture TEST_CAPTURE ?
  WORD           Name of the Capture
  access-list    access-list to be attached
  buffer         Buffer options
  class-map      class name to attached
  clear          Clear Buffer
  control-plane  Control Plane
  export         Export Buffer
  interface      Interface
  limit          Limit Packets Captured
  match          Describe filters inline
  start          Enable Capture
  stop           Disable Capture
  stop_export    Disable Capture and Export Buffer
The next commands configure the same options we used in vManage:
- GigabithEthernet3 as interface
- ICMP packets only (IP protocol 1)
CSR01#monitor capture TEST_CAPTURE interface GigabitEthernet3 both
CSR01#monitor capture TEST_CAPTURE match ipv4 protocol 1 any any
Below are the available options for inline filters.
CSR01#monitor capture TEST_CAPTURE match ?
  any           all packets
  ipv4          IPv4 packets only
  ipv6          IPv6 packets only
  mac           MAC filter configuration
  pktlen-range  Packet length range to capture
CSR01#monitor capture TEST_CAPTURE match ipv4 ?
  A.B.C.D/nn  IPv4 source Prefix <network>/<length>, e.g., 192.168.0.0/16
  any         Any source prefix
  host        A single source host
  protocol    Protocols
CSR01#monitor capture TEST_CAPTURE match ipv4 protocol ?
  <0-255>  An IP protocol number
  tcp      Filter by TCP protocol
  udp      Filter by UDP protocol
CSR01#monitor capture TEST_CAPTURE match ipv4 protocol 1 ?
  A.B.C.D/nn  IPv4 source Prefix <network>/<length>, e.g., 192.168.0.0/16
  any         Any source prefix
  host        A single source host
CSR01#monitor capture TEST_CAPTURE match ipv4 protocol 1 any ?
  A.B.C.D/nn  IPv4 destination Prefix <network>/<length>, e.g., 192.168.0.0/16
  any         Any destination prefix
  host        A single destination host
To validate capture parameters run the command: show monitor capture TEST_CAPTURE. As shown in the listing below, by default, the capture will run till its buffer will reach 10MB.
CSR01#show monitor capture TEST_CAPTURE
Status Information for Capture TEST_CAPTURE
  Target Type:
 Interface: GigabitEthernet3, Direction: BOTH
   Status : Inactive
  Filter Details:
   IPv4
    Source IP:  any
    Destination IP:  any
   Protocol: 1
  Buffer Details:
   Buffer Type: LINEAR (default)
   Buffer Size (in MB): 10
  Limit Details:
   Number of Packets to capture: 0 (no limit)
   Packet Capture duration: 0 (no limit)
   Packet Size to capture: 0 (no limit)
   Maximum number of packets to capture per second: 1000
   Packet sampling rate: 0 (no sampling)
Now we can activate the defined capture.
CSR01#monitor capture TEST_CAPTURE start
After running some pings from a test PC connected to the service side via GigabitEthernet3, we can validate that packets are being captured. The brief format is shown below. Detailed and dump options display truncated and full packet content.
CSR01#show monitor capture TEST_CAPTURE buffer ?
  brief     brief display
  detailed  detailed disaply
  dump      for dump
  |         Output modifiers
  <cr>      <cr>

CSR01#show monitor capture TEST_CAPTURE buffer brief
 ----------------------------------------------------------------------------
 #   size   timestamp     source             destination      dscp    protocol
 ----------------------------------------------------------------------------
< output omitted >
  11   74   83.561967   192.168.11.10    ->  15.15.15.10      0  BE   ICMP
  12   74   83.561967   15.15.15.10      ->  192.168.11.10    0  BE   ICMP
Let’s stop packet capture with the following command.
CSR01#monitor capture TEST_CAPTURE stop
To analyze packet capture buffer offline, use export it using the command shown below:
CSR01#monitor capture TEST_CAPTURE export ?
  bootflash:  Location of the file
  flash:      Location of the file
  ftp:        Location of the file
  http:       Location of the file
  https:      Location of the file
  pram:       Location of the file
  rcp:        Location of the file
  scp:        Location of the file
  sftp:       Location of the file
  tftp:       Location of the file

CSR01#monitor capture TEST_CAPTURE export bootflash:test_capture.pcap
Exported Successfully