Packet capture provides a way of getting a copy of the packets traversing a router. This can be useful for troubleshooting purposes when you want to see if the packets are being received or sent by the router via the expected interface.
There are 2 ways to perform the packet capture – one is using the vManage user interface, and another one is using CLI directly on the router. In this article, we will explain how to use both of them.
Using vManage
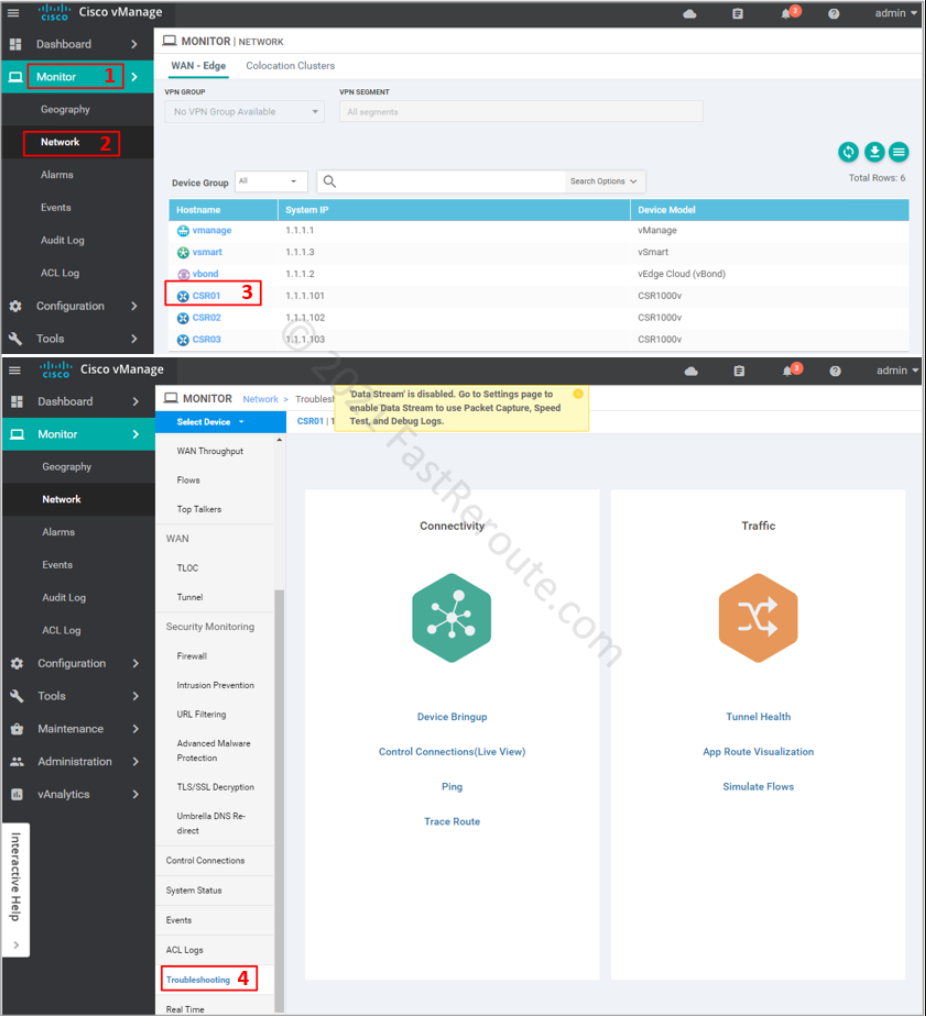
Packet capture is reachable via the Device Troubleshooting page – Monitor > Network > Device name > Troubleshooting. By default, there is no Packet Capture option under the Traffic section, as shown in Figure 1.
Figure 1. Packet Capture in vManage before Data Streaming is enabled
The pop-up alert displays: “Data Stream is disabled. Go to the Settings page to enable Data Stream to use Packet Capture, Speed Test, and Debug Logs”. To run packet captures via vManage we must enable Data Stream.
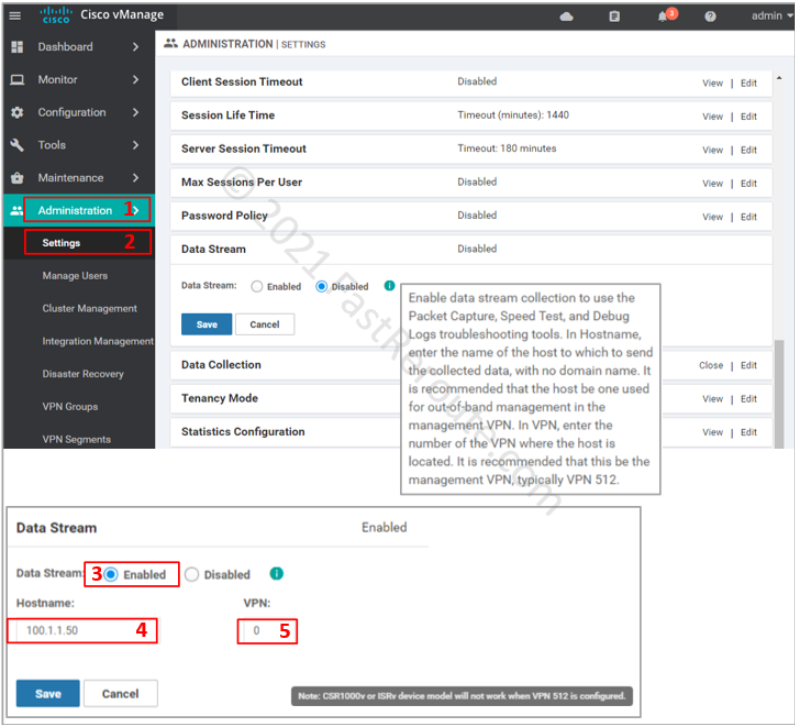
Navigate to Administration > Settings. Then expand the Data Stream option, as shown in the screenshot below. Click on the “Enabled” radio box, type in the hostname, which is the name or IP address of vManage and VPN that the edge router should use to reach the controller.
Figure 2. Enable Data Stream Configuration in vManage
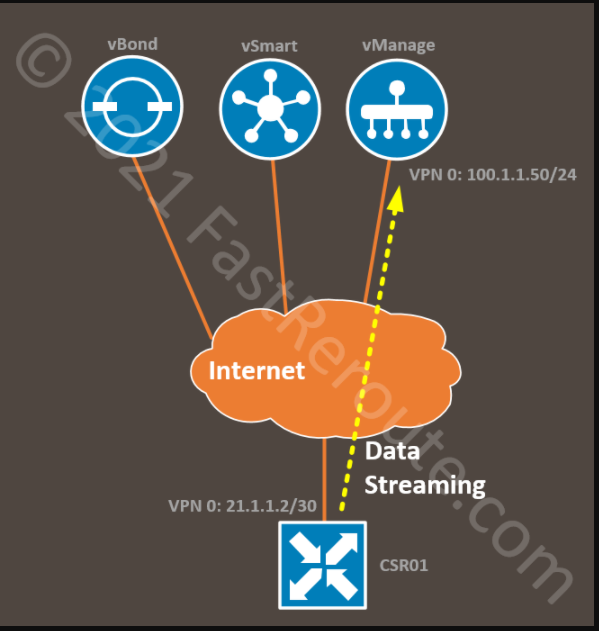
Note that for virtualized platforms, like the one we use for the lab, VPN 512 (out-of-band) cannot be used. To make this work, we are using the public IP of vManage, which is reachable via transport VPN 0. Our lab topology is shown in the figure below.
Figure 3. Data Streaming Topology
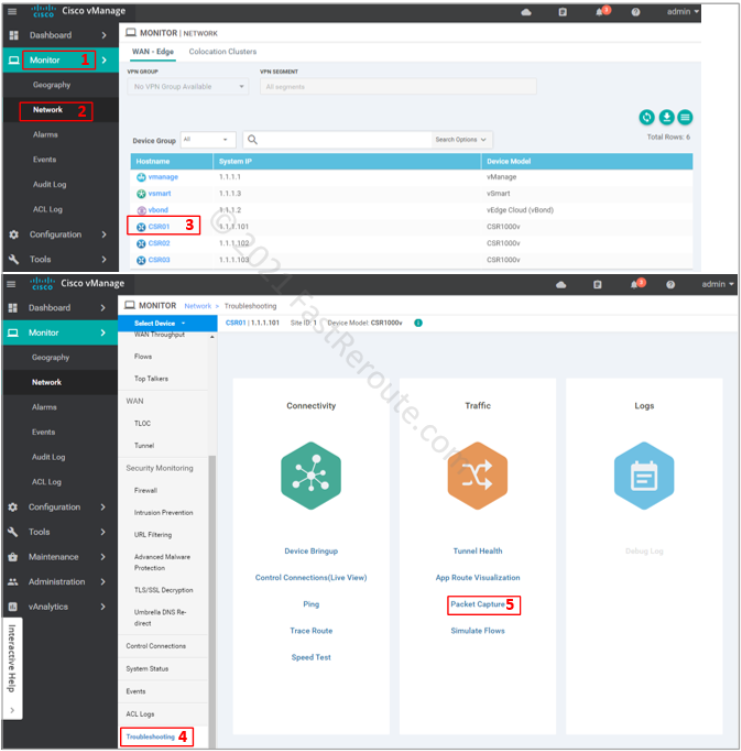
After enabling Data Streaming, the Packet Capture option is now visible in the Troubleshooting section. After clicking on this option, we can define packet capture parameters.
Figure 4. Packet Capture in vManage after Data Streaming is enabled
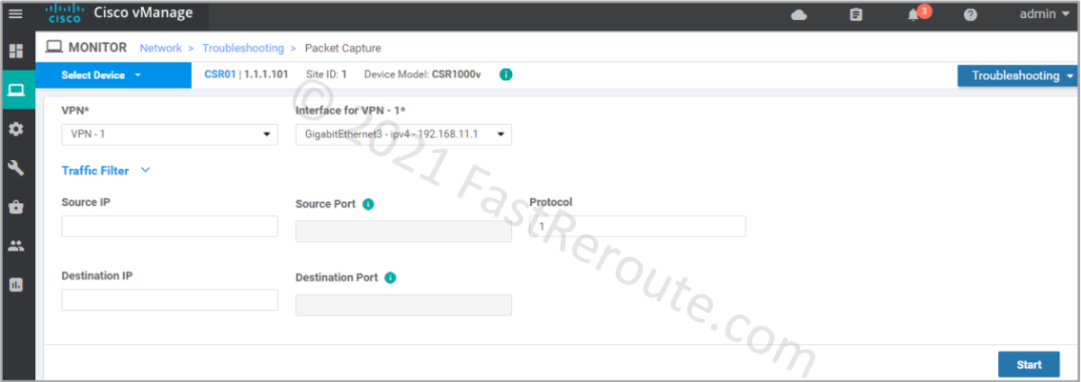
Packet capture screen requires VPN and Interface filter selection. You can optionally provide other filters, such as source and destination IPs and protocol information. Traffic is captured in both ingress and egress directions. Let’s change the filter to protocol 1 (ICMP) and start capture by pressing the Start button.
Figure 5. Packet Capture Parameters
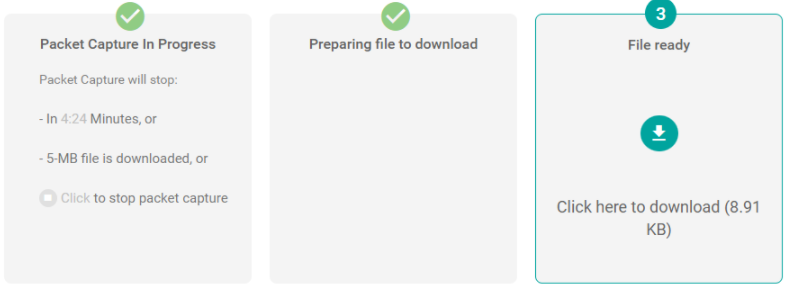
By default, the capture will run for 5 minutes. You can stop the timer at any time to download packets captured so far. The file in pcap format will be available for download shortly.
Figure 6. Packet Capture Progress
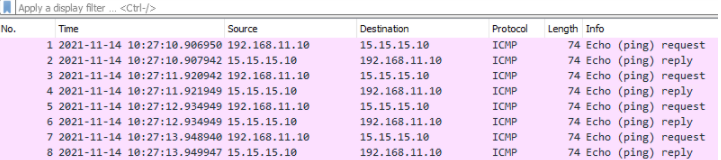
The content of the file can be viewed in Wireshark, as shown below.
Figure 7. Display Captured Packets in Wireshark
CSR01#show monitor capture

Status Information for Capture 71f87e76_847e_4770_8289_56b5242ac115
  Target Type:
 Interface: GigabitEthernet3, Direction: BOTH
   Status : Active
  Filter Details:
   IPv4
    Source IP:  any
    Destination IP:  any
   Protocol: 1
  Buffer Details:
   Buffer Type: LINEAR (default)
   Buffer Size (in MB): 5
  Limit Details:
   Number of Packets to capture: 0 (no limit)
   Packet Capture duration: 300
   Packet Size to capture: 0 (no limit)
   Maximum number of packets to capture per second: 1000
   Packet sampling rate: 0 (no sampling)
Using CLI on the router
If for some reason you can’t use vManage, you can use IOS-XE Embedded Packet Capture directly on the device (the previous process uses this feature on the backend). Use SSH to connect to the device either via client installed on your computer or via the tools menu in vManage.
The next configuration commands provide an example of running packet capture.
Embedded packet capture commands begin with monitor capture commands. They are available in exec mode, other operational commands, like “show” and “debug”.
CSR01#monitor capture ?
  WORD   Name of the Capture
  clear  Clear all Buffers
  start  Enable all capture points
  stop   Disable all capture points
Specify a name for the packet capture instance, in our example it is TEST_CAPTURE. The available command options are shown below.
CSR01#monitor capture TEST_CAPTURE ?
  WORD           Name of the Capture
  access-list    access-list to be attached
  buffer         Buffer options
  class-map      class name to attached
  clear          Clear Buffer
  control-plane  Control Plane
  export         Export Buffer
  interface      Interface
  limit          Limit Packets Captured
  match          Describe filters inline
  start          Enable Capture
  stop           Disable Capture
  stop_export    Disable Capture and Export Buffer
The next commands configure the same options we used in vManage:
GigabithEthernet3 as interface
ICMP packets only (IP protocol 1)
CSR01#monitor capture TEST_CAPTURE interface GigabitEthernet3 both
CSR01#monitor capture TEST_CAPTURE match ipv4 protocol 1 any any
Below are the available options for inline filters.
CSR01#monitor capture TEST_CAPTURE match ?
  any           all packets
  ipv4          IPv4 packets only
  ipv6          IPv6 packets only
  mac           MAC filter configuration
  pktlen-range  Packet length range to capture
CSR01#monitor capture TEST_CAPTURE match ipv4 ?
  A.B.C.D/nn  IPv4 source Prefix <network>/<length>, e.g., 192.168.0.0/16
  any         Any source prefix
  host        A single source host
  protocol    Protocols
CSR01#monitor capture TEST_CAPTURE match ipv4 protocol ?
  <0-255>  An IP protocol number
  tcp      Filter by TCP protocol
  udp      Filter by UDP protocol
CSR01#monitor capture TEST_CAPTURE match ipv4 protocol 1 ?
  A.B.C.D/nn  IPv4 source Prefix <network>/<length>, e.g., 192.168.0.0/16
  any         Any source prefix
  host        A single source host
CSR01#monitor capture TEST_CAPTURE match ipv4 protocol 1 any ?
  A.B.C.D/nn  IPv4 destination Prefix <network>/<length>, e.g., 192.168.0.0/16
  any         Any destination prefix
  host        A single destination host
To validate capture parameters run the command: show monitor capture TEST_CAPTURE. As shown in the listing below, by default, the capture will run till its buffer will reach 10MB.
CSR01#show monitor capture TEST_CAPTURE

Status Information for Capture TEST_CAPTURE
  Target Type:
 Interface: GigabitEthernet3, Direction: BOTH
   Status : Inactive
  Filter Details:
   IPv4
    Source IP:  any
    Destination IP:  any
   Protocol: 1
  Buffer Details:
   Buffer Type: LINEAR (default)
   Buffer Size (in MB): 10
  Limit Details:
   Number of Packets to capture: 0 (no limit)
   Packet Capture duration: 0 (no limit)
   Packet Size to capture: 0 (no limit)
   Maximum number of packets to capture per second: 1000
   Packet sampling rate: 0 (no sampling)
Now we can activate the defined capture.
CSR01#monitor capture TEST_CAPTURE start
After running some pings from a test PC connected to the service side via GigabitEthernet3, we can validate that packets are being captured. The brief format is shown below. Detailed and dump options display truncated and full packet content.
Let’s stop packet capture with the following command.
CSR01#monitor capture TEST_CAPTURE stop
To analyze packet capture buffer offline, use export it using the command shown below:
CSR01#monitor capture TEST_CAPTURE export ?
  bootflash:  Location of the file
  flash:      Location of the file
  ftp:        Location of the file
  http:       Location of the file
  https:      Location of the file
  pram:       Location of the file
  rcp:        Location of the file
  scp:        Location of the file
  sftp:       Location of the file
  tftp:       Location of the file

CSR01#monitor capture TEST_CAPTURE export bootflash:test_capture.pcap
Exported Successfully
SD-WAN deployments use the Internet as the transport to replace WAN networks traditionally designed to leverage centralized Internet access via the data center. Direct Internet Access (DIA) refers to the configuration when Internet-facing traffic breaks out directly from the branch router.
Is Network Address Translation (NAT) required for DIA to operate? Yes, NAT maintains a translation table, that tracks outbound sessions from the service side VPNs (LAN), so the return traffic can be sent back without having to leak service VPN routes into VPN 0.
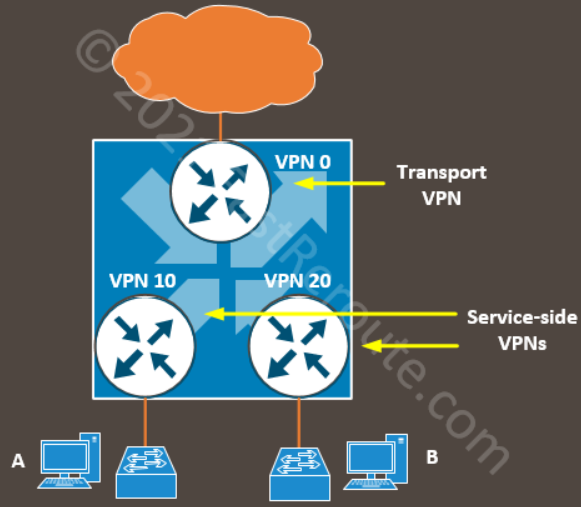
In the Cisco SD-WAN solution, transport-facing and user-facing interfaces belong to different VPNs or VRFs. VPN 0 contains transport (or underlay) network-facing interfaces, such as Internet and MPLS. Service-side VPNs contain user-facing interfaces.
The figure below shows logical VPN isolation within a router. In the routing table of VPN 0, there will be no entries for subnets where Host A and Host B are located. These subnets can even have the same IP addresses.
Figure 1. Transport and Service-Side VPNs and DIA
For DIA to work we need to allow traffic to flow between these virtual routers (or VPNs). To direct traffic from service-side VPNs we can use either static routes or a centralized data policy. NAT in transport VPN allows return traffic to be sent back.
Direct Internet Access on Cisco SD-WAN platforms is enabled in 2 steps. The first one is the NAT configuration on the transport interface. The second step directs traffic from service-side VPN using either a static route or centralized data policy.
Step 1: Enable NAT on the transport interface
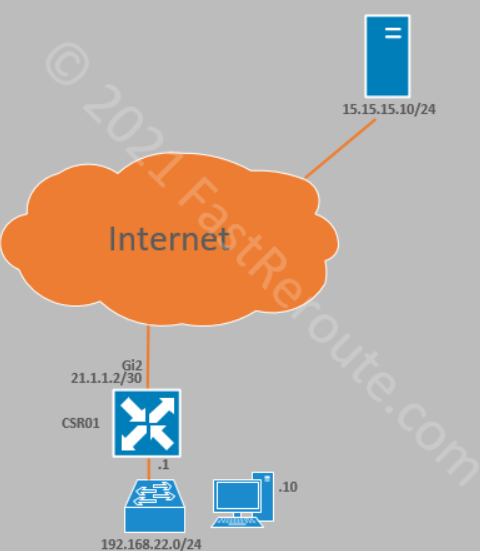
Let’s start with a very basic topology, shown in Figure 2.
Figure 2. Sample DIA Topology
Edge router has a device template assigned, which references a basic set of feature templates required to provide connectivity.
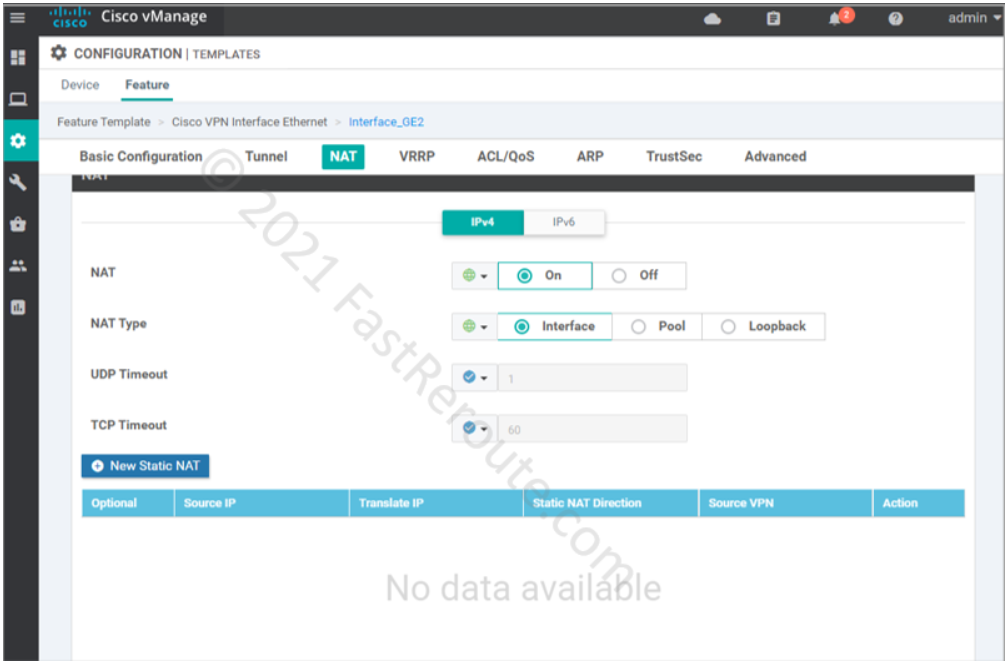
The first step of both static route and policy-based configuration is to enable NAT on an interface in the transport VPN – GigabitEthernet2. This is done by adjusting the interface template.
Figure 3. Enable NAT on transport interface
The following commands are pushed to the device.
ip nat inside source list nat-dia-vpn-hop-access-list interface GigabitEthernet2 overload
ip nat translation tcp-timeout 3600
ip nat translation udp-timeout 60

interface GigabitEthernet2
  ip nat outside
We couldn’t find a way to modify the nat-dia-vpn-hop-access-list used in ip nat insidecommand. This ACL is not visible in the running configuration or in the output of show ip access-lists. In IOS-XE this access list identifies traffic to be translated. In SD-WAN, however, to achieve this data policy needs to be configured.
Step 2: Direct traffic from service-side VPN
There are 2 ways to achieve this:
Static route in service VPN template
Centralized data policy
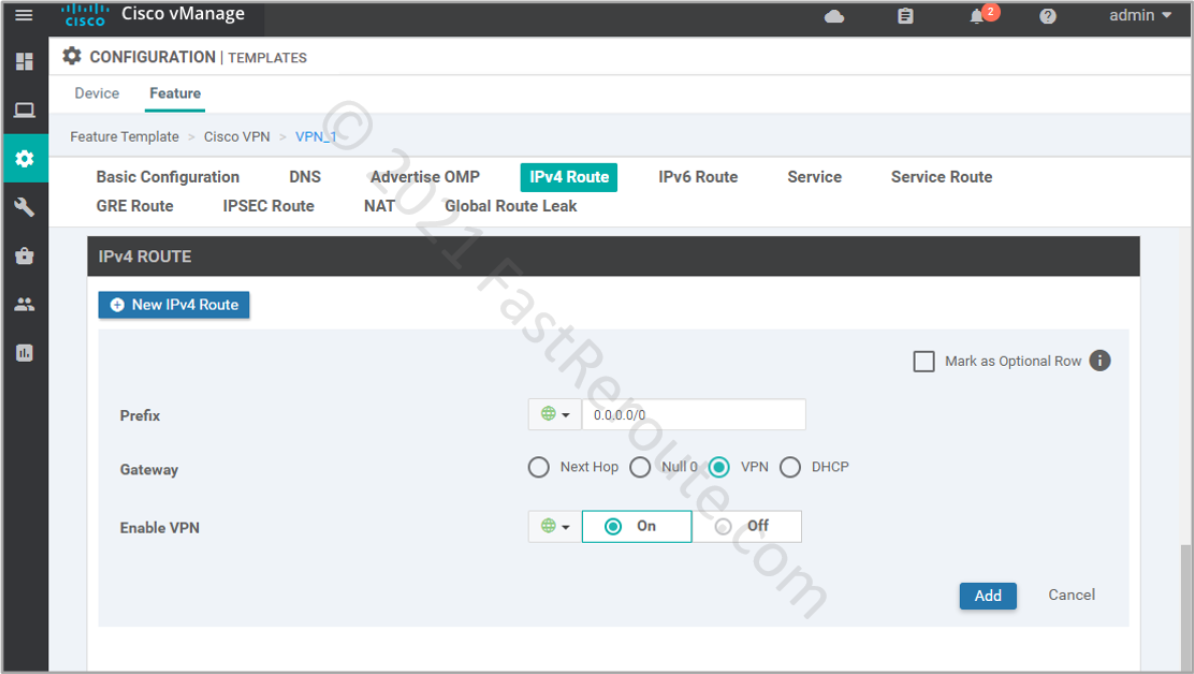
Step 2 (option 1): Static Route Configuration
Let’s configure a static default route under VPN 1 (Service VPN). Note that VPN is selected as a gateway option.
Figure 4. Configure a static default route
The static route command that is pushed to the device looks like this: ip nat route vrf 1 0.0.0.0 0.0.0.0 global
Note that the static route command has nat keyword. If we turn off NAT enabled in the previous step, the route will disappear. This essentially means that you have to do address translation for the configuration to work.
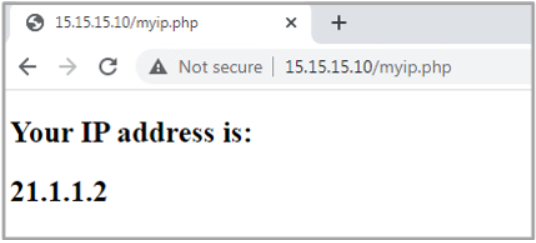
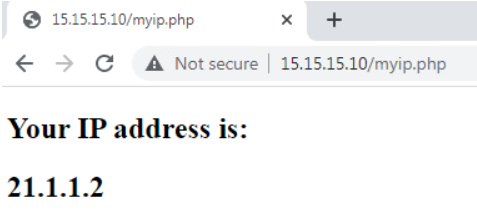
Let’s do the test from our test PC, confirming that the remote server sees the request as it’s coming from the router’s external IP address.
Figure 5. Test NAT configuration from Windows PC
To check the list of translations, we can run the following command on the router:
CSR01#show ip nat translations verbose
Pro  Inside global         Inside local          Outside local         Outside global
tcp  21.1.1.2:5062         192.168.11.10:49158   15.15.15.10:80        15.15.15.10:80
  create: 11/14/21 23:16:21, use: 11/14/21 23:16:27, timeout: 00:00:56
  RuleID : 1
  Flags: timing-out
  ALG Application Type: NA
  WLAN-Flags: unknown
  Mac-Address: 0000.0000.0000    Input-IDB:
  VRF: 1,  entry-id: 0xe9f7f840, use_count:1
  In_pkts: 7 In_bytes: 978, Out_pkts: 7 Out_bytes: 982
  Output-IDB: GigabitEthernet2

CSR01#show ip nat translation
Pro  Inside global         Inside local          Outside local         Outside global
tcp  21.1.1.2:5062         192.168.11.10:49158   15.15.15.10:80        15.15.15.10:80
Step 2 (Option 2): Centralized policy
We have removed the static route created in Step 2 (option 1), as the traffic will be directed by the centralized policy.
To implement DIA we will configure the traffic data section of the centralized policy that will match traffic coming from 192.168.11.0/24 (LAN segment) to 15.15.15.10/32 (the webserver).
Only one centralized policy can be activated globally at a time. The centralized policy contains multiple component policies. In this example, we will define a data policy, which then can be applied to a site list. In the following steps, we will create a new policy.
Create a centralized policy
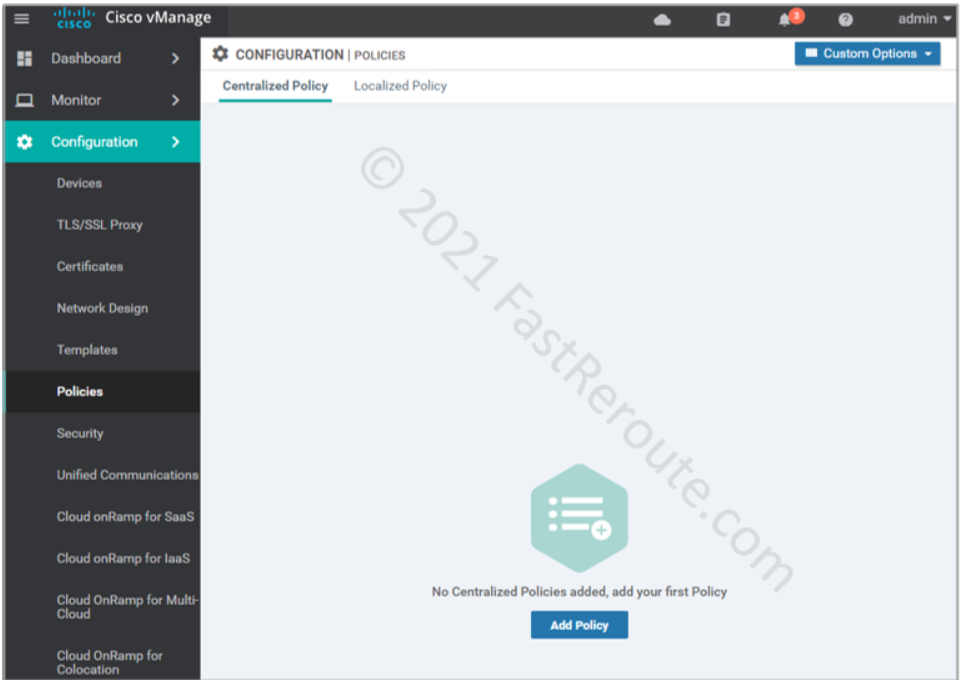
Navigate to Configuration > Policies and click on Add Policy button.
Figure 6. Add Centralized Policy
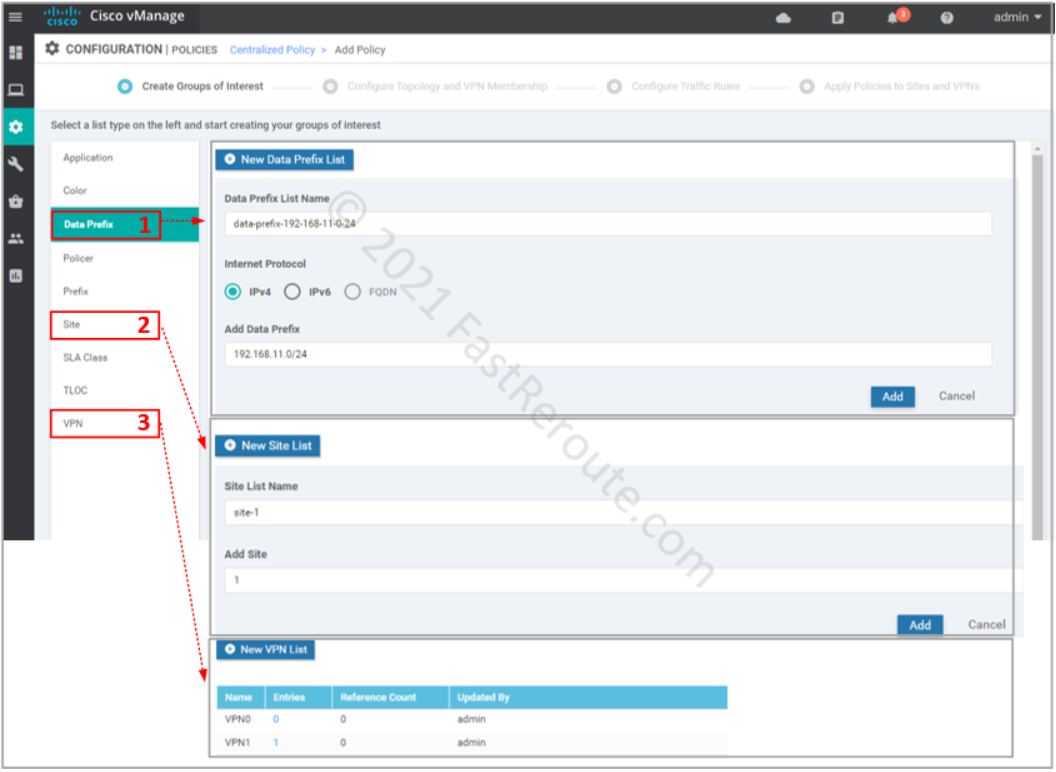
The first step of creating a policy is called “Create Groups of Interest”. These are variables that we can later use in the policy. For our example, we will define:
Data Prefix – for source prefix 192.168.11.0/24, and we will use 15.15.15.10/32 directly in our traffic matching configuration without variable definition
Site List – we want apply only to a single site with Site ID of 1; it is recommended not to have the same site in multiple site lists to ensure that only 1 policy of each type is applied to that site
VPN List – service VPN 1
Figure 7. Configure Groups of Interest (variables)
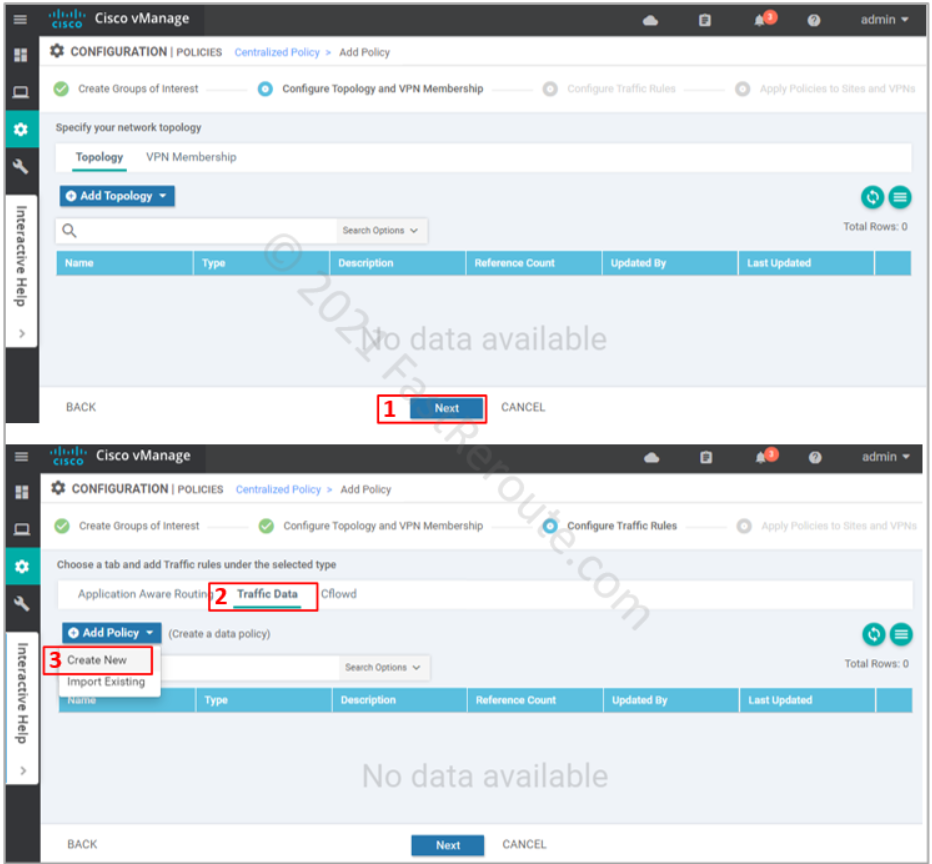
After defining all required variables and pressing the Next button, we are moved to the Topology and VPN Membership section of the wizard (see the top part of the screenshot below). We don’t need to configure anything for our data policy, so we just press Next.
On the Configure Traffic Rules step of the wizard click on the “Traffic Data” section of the policy, click on Add Policy > Create New (refer to the bottom part of the next screenshot).
Figure 8. Configure Traffic Rules
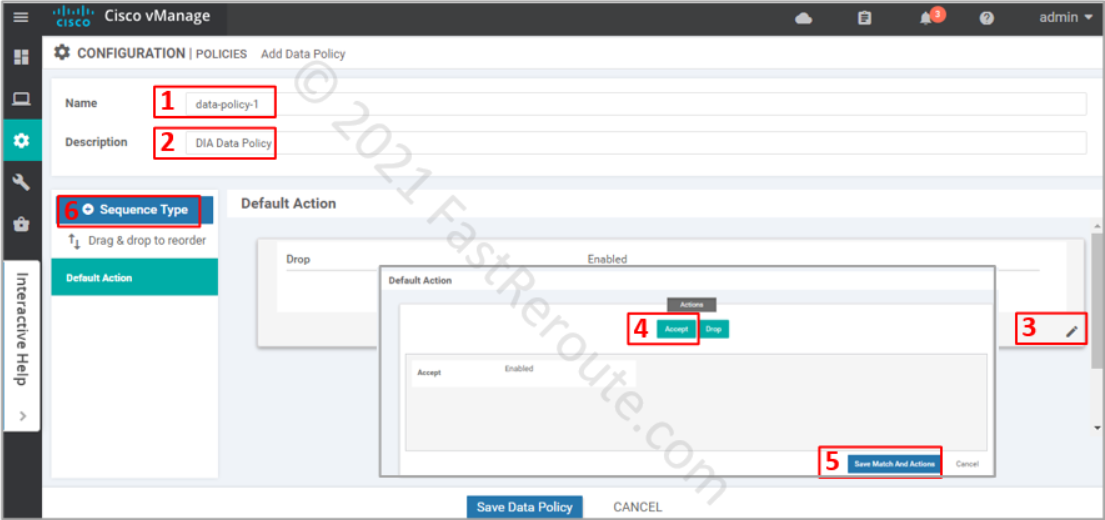
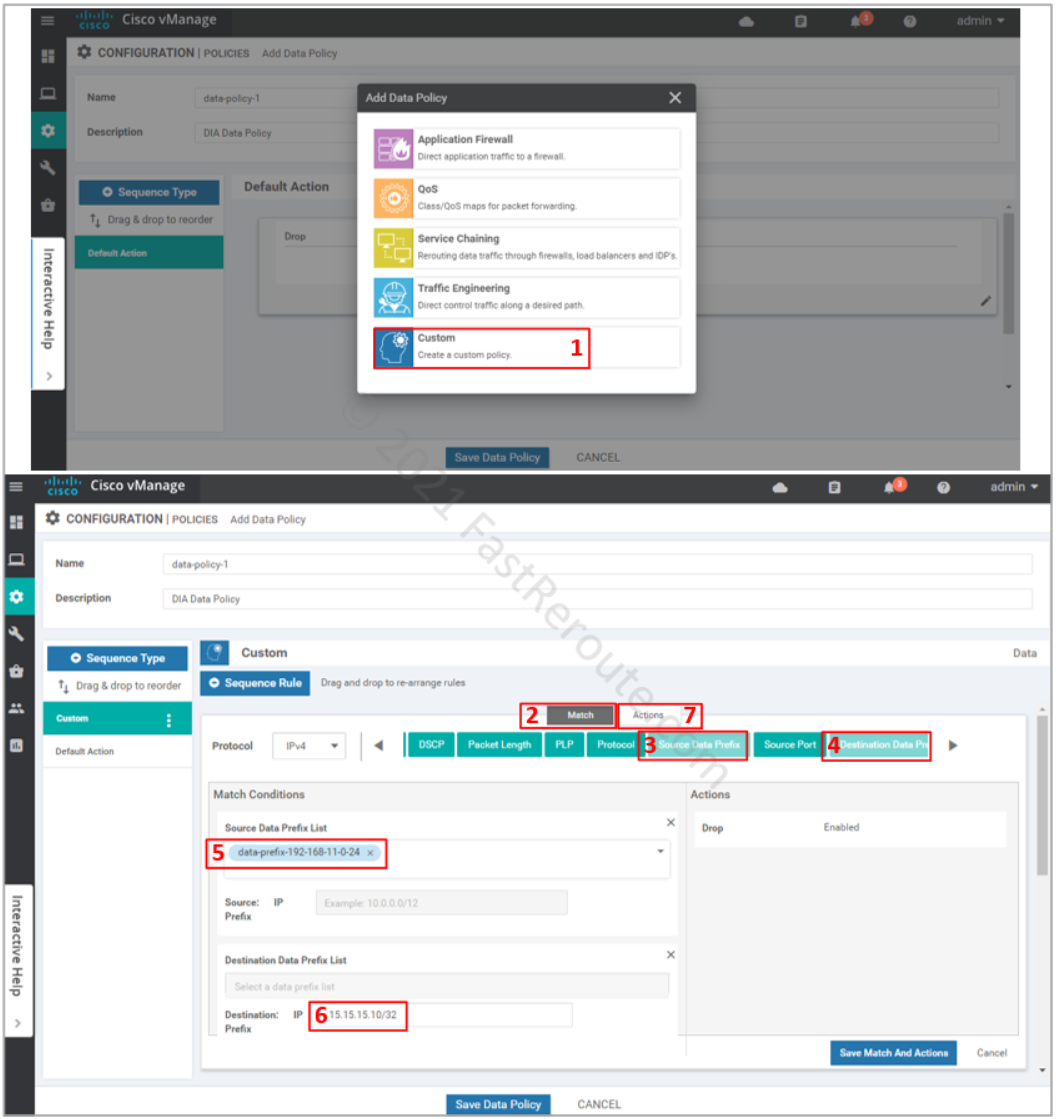
In a new data policy window enter the name and description of the policy. Adjust the default action to Accept to ensure that the packets that don’t match our criteria for DIA will not be dropped. Finally, press + button to add a rule that will be matching DIA traffic and apply NAT to it.
Figure 9. Create Data New Policy
In the pop-up window select Custom policy. The other options are just a subset of the match and set conditions tailored for different scenarios, custom lists all of them.
Custom rule is added on top of the default action. If there are several rules, you can re-arrange them on the left panel. Ensure that the Match section is selected, add Source and Destination data prefixes to set the conditions for the rule.
Select the data prefix that we set up earlier in groups of interest as the source. Type-in destination as the actual address without the use of the variable. Both options lead to the same result, however, the use of variables allows you to use descriptive naming of the object plus adjusting the values outside of the policy configuration. Click on the Actions button.
Figure 10. Add a new custom rule to the policy and define match conditions
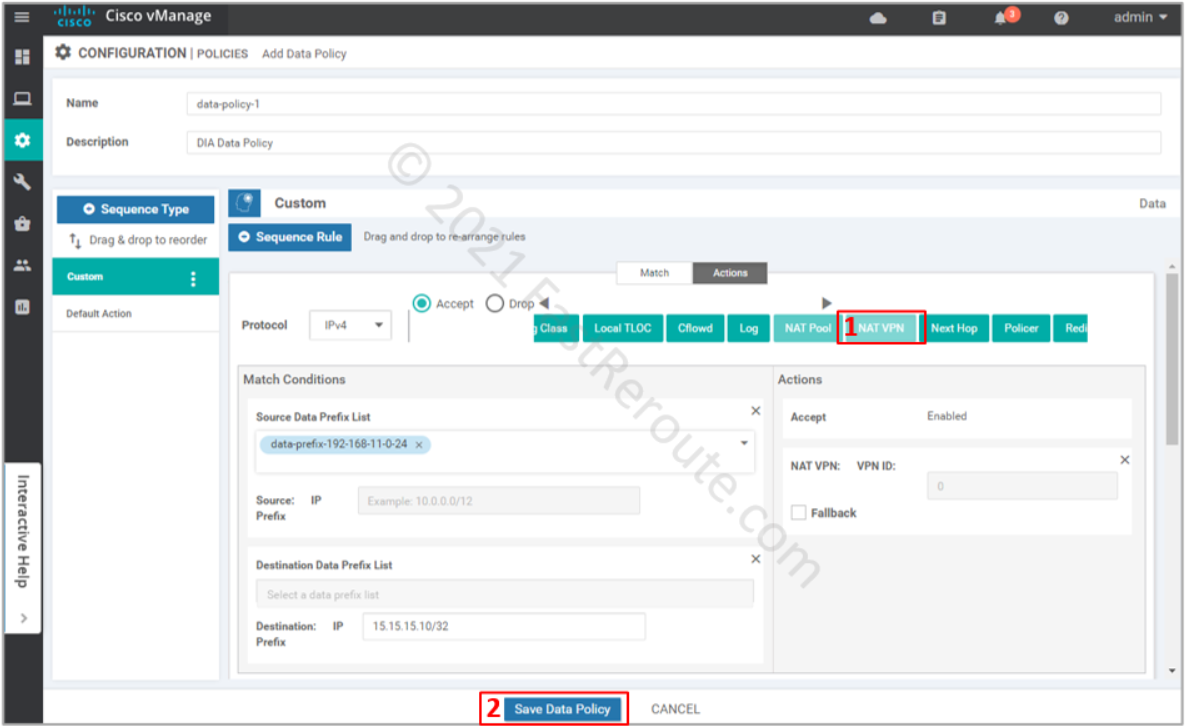
Select NAT VPN action, as shown in the following screenshot. The fallback option is useful when you want this traffic to follow the routing table when NAT cannot be used, for example, when the interface is down. Press the “Save data policy” button.
Figure 11. Set policy action to NAT VPN
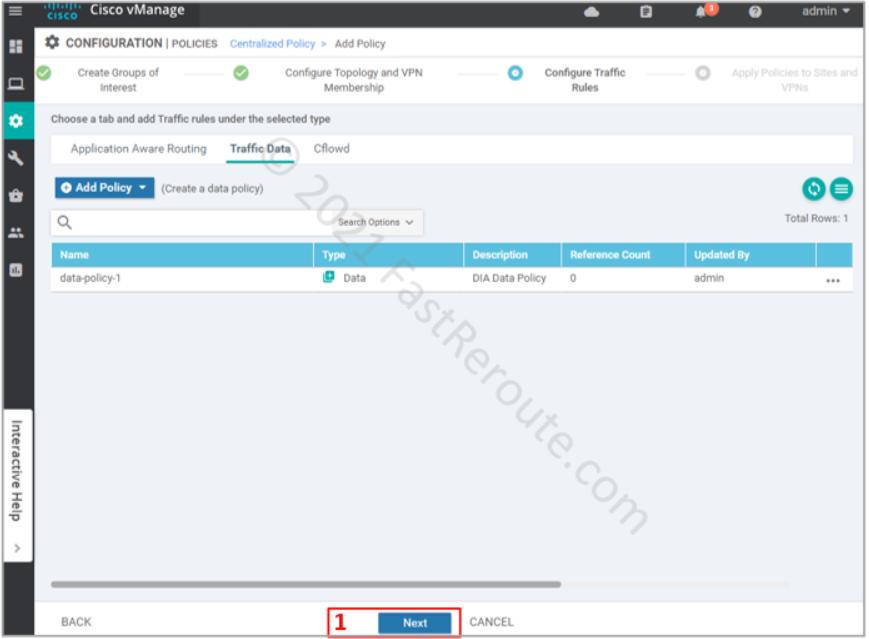
The next screenshot list the data policy that we built in the previous step. Notice that the reference count is 0, as we haven’t yet applied it yet. Press Next.
Figure 12. Traffic data policies
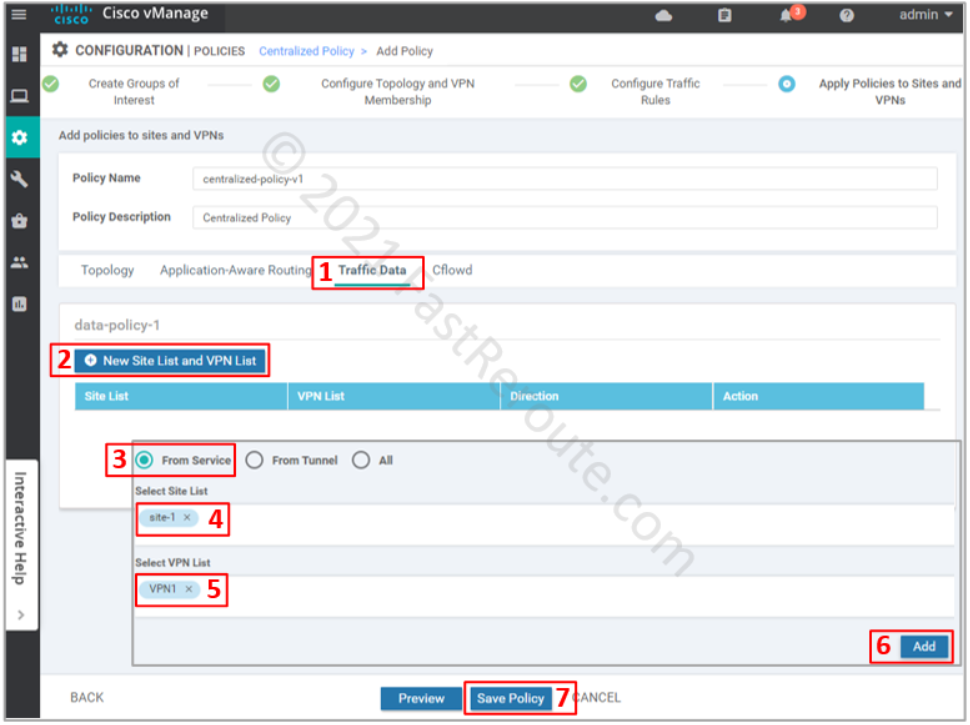
The final step is to apply the policy. Click on the Traffic Data section, and then under data-policy-1 press “New Site List and VPN List”. In the pop-up window select “From Service” direction, site-1 as the site list, and VPN1 as the VPN list. Press the Save Policy button.
Figure 13. Apply data policy
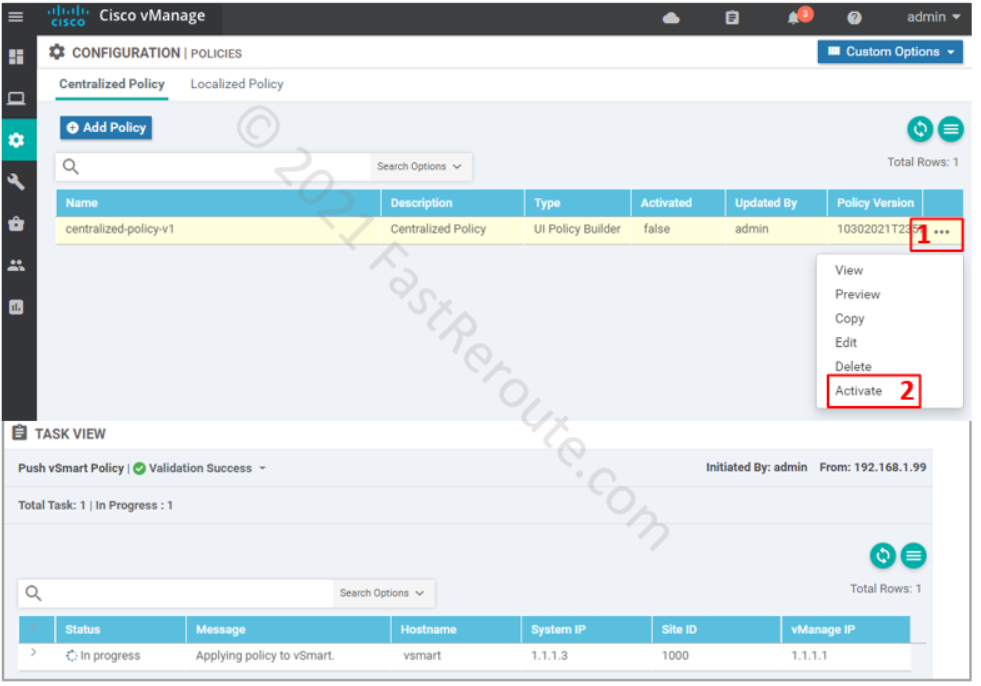
The final step is to activate the policy.
Figure 14. Activate centralized policy
At this stage vManage will push the policy to vSmart as part of its running-config:
vSmart will use OMP to distribute the policy to edge routers. In contrast to vSmart, edge routers will not display the policy in the running configuration. Use show sdwan policy from-vsmart command instead.
Let’s check from the client machine that NAT works:
CSR01#show ip nat translation
Pro  Inside global         Inside local          Outside local         Outside global
tcp  21.1.1.2:5064         192.168.11.10:62121   15.15.15.10:80        15.15.15.10:80
Cisco SD-WAN devices can be either in vManage or CLI mode.
In vManage mode, the configuration is performed on vManage and then pushed to the device. Local configuration changes are not allowed. In CLI mode, changes are performed locally on the device. vManage mode is the preferred and recommended option for most SD-WAN implementations. However, you can occasionally switch devices into CLI mode to perform specific tasks.
Administrators can connect to the device using SSH or serial console to use various show and debug commands in both modes.
We will focus on edge devices in this article. However, controllers can also be in one of these modes. Cisco-hosted controllers are initially provisioned in CLI mode and then converted to vManage mode by a network administrator. Some features require controllers to be switched to vManage mode.
vManage mode
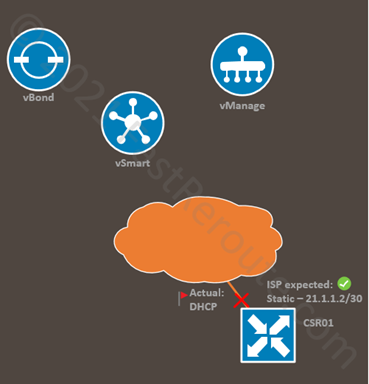
Consider a sample network shown in Figure 1. Our task is to prepare an edge router for a remote office. We’ve applied the required feature and device templates with dynamic IP assignment on the Internet-facing interface. After the router is shipped to the remote location and plugged in, it cannot establish connectivity to vManage. We discover that the ISP doesn’t have DHCP enabled, and a static IP configuration is required.
Figure 1. SD-WAN Edge Sample Scenario
Let’s assume that we can access the router via console cable attached to a laptop on-site.
Run the “show sdwan system status” command on the edge device to validate the device mode. In the sample output below, the CSR01 router is in vManage mode (vManaged: true).
CSR01#show sdwan system status
Viptela (tm) vEdge Operating System Software
Copyright (c) 2013-2021 by Viptela, Inc.
Controller Compatibility: 20.3
Version: 17.03.03.0.4762

<output omitted>

Personality:             vEdge
Model name:              CSR1000V
Services:                None
vManaged:                true
Commit pending:          false
Configuration template:  CSR01

<output omitted>
Firstly, we try to set a static IP address on the transport interface using CLI. We use the “config-t” command to enter the configuration mode. The “commit” command activates the configuration.
CSR01#config-t
CSR01(config)# interface GigabitEthernet 2
CSR01(config-if)# ip address 21.1.1.2 255.255.255.252
CSR01(config-if)# commit
The following warnings were generated:
  'system is-vmanaged': This device is being managed by the vManage. Any configuration changes to this device will be overwritten by the vManage after the control connection to the vManage comes back up.
Proceed? [yes,no] yes
Commit complete.

CSR01#show run interface GigabitEthernet 2
Building configuration...

<output omitted>

interface GigabitEthernet2
 description Transport Interface
 ip address 21.1.1.2 255.255.255.252
In our example, we didn’t have connectivity to vManage, so the changes were committed. However, as the warning message above advises vManage will overwrite modifications done on the device (see the example in the following listing) once the control connection is up.
CSR01#show run interface GigabitEthernet 2
Building configuration...

<output omitted>

interface GigabitEthernet2
 description Transport Interface
 ip address dhcp
Rollback to the original configuration (i.e. setting dynamic IP on the transport interface) causes connectivity to vManage fail, which introduces the connectivity problem we tried to solve in the first place. When we have connectivity to vManage, the CLI commands are just rejected, as shown in the listing below. vManage mode doesn’t permit changes on the edge device.
CSR01#config-t
CSR01(config)# interface GigabitEthernet2
CSR01(config-if)# ip address 21.1.1.2 255.255.255.252
CSR01(config-if)# commit
Aborted: 'system is-vmanaged': This device is being managed by the vManage. Configuration through the CLI is not allowed.
CLI Mode
There are several solutions to the problem described above. The first is to switch the device into CLI mode beforehand before sending it to the remote location. We can then adjust the configuration and set static IP address, and move the device back to vManage mode.
The second solution is using hidden support commands, which is not a supported way of configuring the device unless directed by Cisco TAC. However, it works and can be helpful in lab environments or as a quick fix to get the branch running (with full router reset later).
Let’s see how both options work with the examples below.
Switching device to CLI mode via vManage
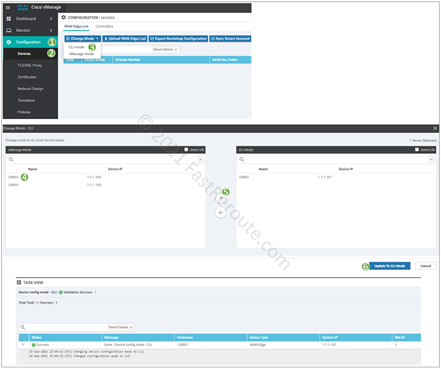
An administrator can switch the device to CLI mode (and back) via vManage. Navigate to Configuration > Devices. Click on the Change Mode drop-down menu and select CLI mode.
Figure 2. Switching device to CLI mode via vManage
In the dialog window, select and move to the right panel the router you want to switch into CLI mode and click on Upgrade to CLI Mode.
After the conversion, we can use “show sdwan system status” command to validate that the vManaged property is false.
CSR01#show sdwan system status
Viptela (tm) vEdge Operating System Software
Copyright (c) 2013-2021 by Viptela, Inc.
Controller Compatibility: 20.3
Version: 17.03.03.0.4762
Build: Not applicable

<output omitted>

Personality:             vEdge
Model name:              CSR1000V
Services:                None
vManaged:                false
Commit pending:          false
Configuration template:  None

<output omitted>
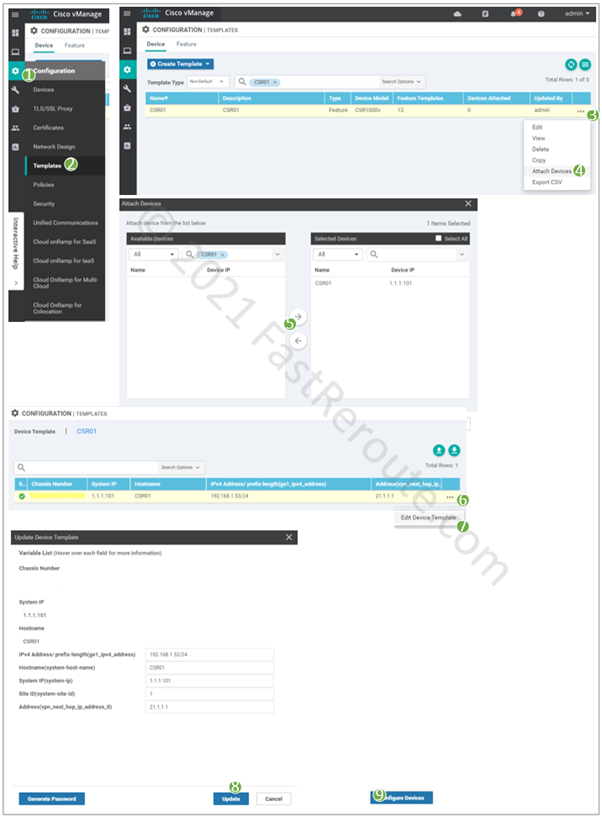
After the device comes back online, we can update templates to include static IP address configuration and switch it back to the vManage mode. To do this, we need to attach the device template to the vEdge router. If the device had a template attached before, the variable values would be populated automatically.
Figure 3. Switching device to vManage mode
Switching device to CLI mode using hidden commands
This procedure in this section uses hidden commands and should be used only as a last resort. Cisco TAC may not support it; use it at your own risk.
When the router hasn’t been switched to CLI mode beforehand and cannot establish a control connection to vManage, refer to the following example to switch to CLI mode.
After entering the configuration mode, let’s see available options under the system command:
CSR01#config-t
CSR01(config)# system ?
Possible completions:
  admin-tech-on-failure      Collect admin-tech before reboot due to daemon failure
  allow-same-site-tunnels    Allow tunnels to be formed between vEdges in the same site
  console-baud-rate          Console baud-rate
  control-session-pps        Control session policer rate, in packets per second
  controller-group-list      Controller group list
  debug
  description                System description
  device-groups              List of vManage groups to which the device belongs
  disable
  domain-id                  Domain ID
  environment
  fnf
  gps-location               GPS latitude and longitude of the device
  host-policer-pps           Rate at which to police packets bound to the control plane (in pps) per QOS level
  icmp-error-pps             Rate at which to police ICMP error messages either generated or received (in pps).
  idle-timeout               Idle CLI timeout, in minutes
  ignore
  location                   Location description of the device
  max-controllers            (DEPRECATED) Set the maximum number of controllers to which the device can connect - Deprecated in 15.4
  max-omp-sessions           Set the maximum number of OMP sessions the device can have
  mode-button
  mtu
  on-demand                  Set various configuration for On-demand tunnels
  organization-name          Organization name
  overlay-id                 Overlay ID
  port-hop                   Enable port hopping for all tlocs
  port-offset                Port offset (unique value; use only if multiple Viptela devices are behind the same NAT)
  site-id                    Site ID
  sp-organization-name       Service Provider Organization name
  system-ip                  System IP address
  system-tunnel-mtu          Control tunnel MTU
  tcp-optimization-enabled   Carve out a dedicated core to use for TCP optimization - applies after reboot
  timer                      Set various timer timeouts
  tls                        ssl-opt cert management config
  track-default-gateway      Enable/Disable default gateway tracking
  track-interface-tag        OMP Tag attached to routes based on interface tracking
  track-transport            Enable transport tracking
  upgrade-confirm            Configure software upgrade confirmation timeout
  vbond                      Configure remote vBond or local IPv4 vbond address
  <cr>
“unhide viptela_internal” command enables the display of “system” command hidden options. The example below shows these subcommands.
CSR01(config)# unhide viptela_internal
CSR01(config)# system ?
Possible completions:
  admin-tech-on-failure          Collect admin-tech before reboot due to daemon failure
  allow-same-site-tunnels        Allow tunnels to be formed between vEdges in the same site
  allow-sw-vedge                 (HIDDEN) Allow non-release software vedges to operate without certificates
  console-baud-rate              Console baud-rate
  control-session-pps            Control session policer rate, in packets per second
  controller-group-list          Controller group list
  daemon-reboot                  (HIDDEN) Reboot device if a non-restartable daemon fails
  daemon-restart                 (HIDDEN) Restart restartable daemons if they fail
  debug
  description                    System description
  device-groups                  List of vManage groups to which the device belongs
  disable
  dnsd-ttl                       config DNS reply TTL in secs
  domain-id                      Domain ID
  dpi-cache-expiry               (HIDDEN) Cache expiry time in minutes
  dpi-cache-size                 (HIDDEN) Cache size
  dpi-disable-track-tx           (HIDDEN) Enable/Disable DPI TRACK TX
  dpi-enable                     (HIDDEN) Enable/Disable DPI
  dpi-gc-time                    (HIDDEN) Garbage collect time in secs
  dpi-multicore                  (HIDDEN) Enable multi-core for dpi
  dpi-stat-time                  (HIDDEN) Stats collection time for dpi
  environment
  fnf
  fp-buffer-check                (HIDDEN) Enable fastpath buffer validity check
  fp-qos-interval                config fp qos interval
  fp-qos-weight-percent-factor   config fp qos weight percent factor
  gps-location                   GPS latitude and longitude of the device
  host-policer-pps               Rate at which to police packets bound to the control plane (in pps) per QOS level
  icmp-error-pps                 Rate at which to police ICMP error messages either generated or received (in pps).
  idle-timeout                   Idle CLI timeout, in minutes
  ignore
  increase-bp-count              (HIDDEN) Increase port backpressure threshold for all ports
  is-vmanaged                    Device is managed by the vmanage
  last-vmanage-transaction-id    Used by vManage to maintain integrity of transactions initiated by it towards device
  location                       Location description of the device
  max-controllers                (DEPRECATED) Set the maximum number of controllers to which the device can connect - Deprecated in 15.4
  max-omp-sessions               Set the maximum number of OMP sessions the device can have
  mode-button
  mtu
  on-demand                      Set various configuration for On-demand tunnels
  organization-name              Organization name
  overlay-id                     Overlay ID
  patch-confirm                  (HIDDEN) Configure software patch confirmation timeout
  port-bp-threshold              configure port backpressure threshold
  port-hop                       Enable port hopping for all tlocs
  port-offset                    Port offset (unique value; use only if multiple Viptela devices are behind the same NAT)
  pseudo-confirm-commit          Only valid for vmanage ..
  reboot-on-failure              (HIDDEN) Reboot device if any daemon fails
  simulated-color                Simulated device's color
  simulated-devices              Additional number of simulated devices
  simulated-wan-ip               Starting IP address for the simulated interface
  site-id                        Site ID
  sp-organization-name           Service Provider Organization name
  system-ip                      System IP address
  system-tunnel-mtu              Control tunnel MTU
  tcp-optimization-enabled       Carve out a dedicated core to use for TCP optimization - applies after reboot
  timer                          Set various timer timeouts
  tls                            ssl-opt cert management config
  track-default-gateway          Enable/Disable default gateway tracking
  track-interface-tag            OMP Tag attached to routes based on interface tracking
  track-transport                Enable transport tracking
  unpin-flows-with-reboot        (HIDDEN) Enable with reboot OR Disable flow pinning to FP cores
  upgrade-confirm                Configure software upgrade confirmation timeout
  vbond                          Configure remote vBond or local IPv4 vbond address
  ztp-status                     ZTP status
  <cr>
To switch the device to CLI mode, use is-vmanaged option.
CSR01(config)# interface GigabitEthernet 2
CSR01(config-if)# ip address 21.1.1.2 255.255.255.0
CSR01(config-if)# commit
Aborted: 'system is-vmanaged': This device is being managed by the vManage. Configuration through the CLI is not allowed.

CSR01(config-if)# exit
CSR01(config)# system is-vmanaged false
CSR01(config-system)# commit
Commit complete.
CSR01#show run int GigabitEthernet 2
Building configuration...

interface GigabitEthernet2
 description Transport Interface
 ip dhcp client default-router distance 1
 ip address 21.1.1.2 255.255.255.0
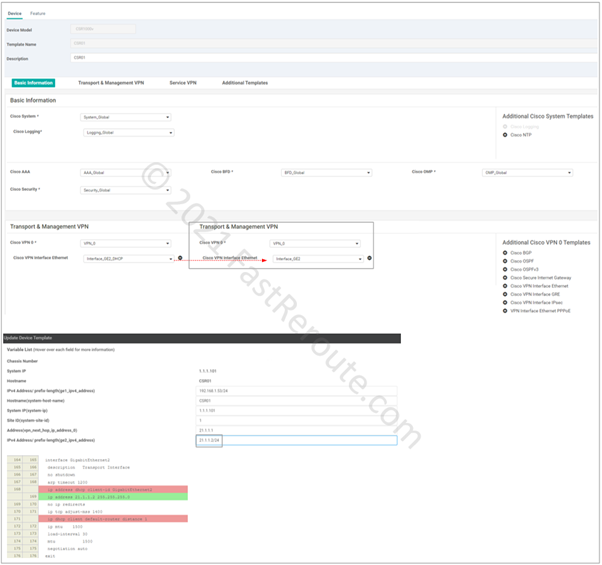
The device will connect to vManage. However, the controller will not overwrite the configuration. At this stage, vManage’s view of the router configuration will not reflect the actual state. We need to remediate this as soon as possible, either by switching the device to CLI mode or applying a configuration template that brings consistency. Let’s update the device template to use static interface configuration to get to the consistent state. In the screenshot below, we see the template adjustments. The bottom part of the figure contains the snippet of the command difference. As we saw in the previous command listing, the device already had a static IP address configured, but vManage is not aware of that change, so from its perspective, the device still has DHCP settings configured.
Figure 4. Apply Device Template to WAN Edge
Changing WAN Edge System IP
In the final section of this blog post, let’s see another example when switching to CLI mode can be helpful. When done via template change, the change of System IP can cause the configuration push to be stuck and not apply correctly.
As a workaround, you can switch the device into CLI mode, change System IP, and move it to template configuration back. Follow the steps below.
Step 1. To switch the device to CLI mode, refer to the procedure described in the first section and Figure 2.
Step 2. Using CLI apply the configuration change. In the example below, we change System IP from 1.1.1.101 to 1.1.1.11.
Step 3. Move device to vManaged mode by applying template and ensuring that the System IP variable matches the new value.
I’ve posted earlier overview articles about Cisco’s WAN and Data Center software-defined technologies – Cisco Viptela SD-WAN (link) and ACI (link). Now it’s time to explore the solution for LAN. Cisco SD-Access is the evolutionary step in how campus networks are built and operated. In this blog post, we will discover components of Cisco SD-Access, namely control and data plane elements.
What are the main SD-Access benefits?
The key advantage of a software-defined solution is management centralization. DNA Center with SD-Access application simplifies campus network operation by providing a single point of management for multiple devices. DNA Center not only automates devices configuration but also exposes APIs, so it can be accessed programmatically.
With Cisco SD-Access administrators can create and apply common policies across the entire campus network. Operational expense savings is one of the main selling points of the Cisco SD-Access.
Network flow telemetry gives operators better visibility into what is happening in the network. Cisco ISE and TrustSec provide user and device identification and segmentation within the same virtual network boundary. SD-Access can also support fully isolated virtual networks, for example, between multiple tenants. As a result better security is achieved with less effort.
Components of Cisco SD-Access
SD-Access consists of 3 categories of components:
Network fabric – Switches,
routers, wireless LAN controllers and access points. Routed access with VXLAN
data plane and LISP control plane
Cisco DNA Center with SD-Access
– one or multiple appliances
Cisco ISE – one or multiple
appliances
Check this document for detailed information on supported component combinations and licensing requirements (external link).
This link is an official matrix listing compatibility between versions of different components.
SD-Access Fabric
Switches and Routers
Different roles that switches can perform
will be covered in later sections of this article. However, for the purpose of right
platform selection 2 main switch roles should be considered – Edge and
Border/Control plane nodes.
Edge switches are similar to access switches, as they have end-user devices connected to them and platforms that currently recommended (Catalyst 9000) and supported (other platforms; check the release notes and licensing documentation for feature support) are listed below:
Catalyst 9000-series: 9200,
9300, 9400, 9500
Catalyst 3850 and 3650
Catalyst 4500E: Sup 8-E, 9-E
Border/Control plane switches perform
Endpoint ID tracking and are responsible for running Layer 3 routing with
networks outside of the fabric. Therefore, these switches have higher memory requirements.
If only control plane operation to be implemented with no traffic transit routing
virtual CSR 1000v can be used. And when border node functions without control
plane operations are required Nexus 7700 is a supported option.
Border/Control plane switches and routers to
choose from are:
Catalyst 9000-series: 9300,
9400, 9500, 9600
Catalyst 3850
Catalyst 6500/6807-XL: Sup 2T,
6T
Catalyst 6840-X, 6880-X
Nexus 7700: Sup 2-E, 3-E, M3
line cards only – border functionality only
ISR 4300, 4400
ASR 1000-X, 1000-HX
CSR 1000v
Fabric Wireless Controllers and Access Points
SD-Access supports traditional WLCs and APs without integration with fabric and they communicate between each other in overlay over-the-top as any other data traffic. Fabric-integrated Wireless Controllers and Access Points participate in the control plane and data flow is changed in comparison with traditional WLCs and APs.
This integration provides additional benefits
and better efficiency. For example, user traffic from a fabric access point is de-capsulated
on the edge switch without tunneling it up to its WLC. This section lists
supported fabric-integrated wireless components.
Supported WLCs are:
Catalyst 9800 Wireless
Controller: 9800-40, 9800-80, 9800-CL and Embedded on C9300, C9400 and C9500
Cisco 3504, 5520 and 8540 WLC
Fabric mode APs must be directly connected
to a fabric edge node. Supported models are:
WiFi 6 APs: Catalyst 9115AX,
9117AX and 9120AX
Wave 2 APs: Aironet 1800, 2800
and 3800
Wave 2 APs, outdoor models:
Aironet 1540, 1560
Wave 1 APs: Aironet 1700, 2700
and 3700
Aironet 4800 APs
DNA Center
DNA Center is responsible for fabric management. The software must be installed on a physical DNA Center Appliance which is based on the Cisco UCS C-series Server. SD-Access is one of the applications of DNA Center.
Check this article dedicated to DNA Center role and functions.
If DNA Center appliance becomes unavailable
fabric would continue to function, however, automatic provisioning will be
impacted. For redundancy, a highly available cluster of 3 nodes of the same
model is recommended.
DNA Center Appliances have 3 options to choose
from:
Entry-level of up to 1,000 devices: DN2-HW-APL (C220 M5, 44 cores)
Mid-size of up to 2,000 devices: DN2-HW-APL-L (C220 M5, 56 cores)
Large of up to 5,000 devices: DN2-HW-APL-XL (C480 M5, 112 cores)
Identity Services Engine (ISE)
Cisco Identity Services Engine (ISE) provides identity services for the solution. Access control policies which are based on user and device identity are also ISE’s responsibility. With Cisco TrustSec edge device applies Security Group Tags (SGTs) on the traffic based on the identity. Then these tags can be used to perform filtering using SGT-based access-lists.
ISE is available as a virtual or a physical
appliance. The following models of ISE appliances are available:
Small physical: SNS-3515
Large physical: SNS-3595
Small virtual: R-ISE-VMS
Medium virtual: R-ISE-VMM
Large virtual: R-ISE-VML
ISE appliances can also be implemented in a high-availability setup with load balancing achieved by splitting functions between nodes.
Cisco ISE integrates with DNA Center using
REST API and PXGrid. DNA uses REST API to automate policy configuration on ISE
and PXGrid is used for endpoint information exchange.
Data Plane
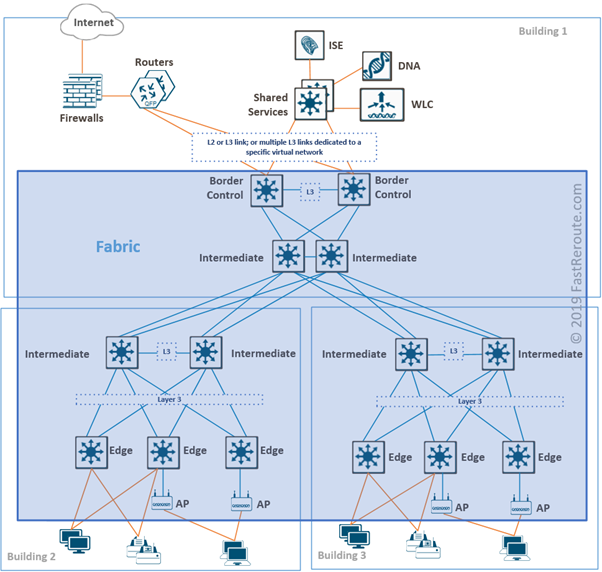
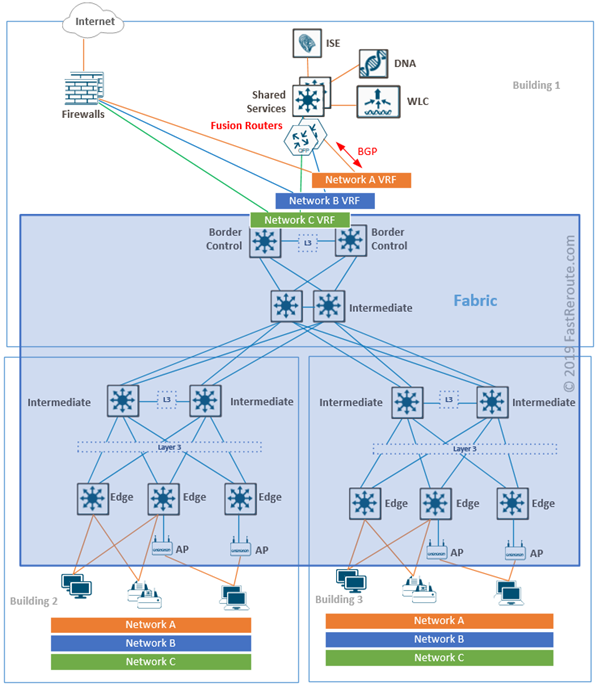
Figure 1 shows a sample network. Fabric is shown in a blue rectangle. Fabric switches in SD-Access are connected to each other using Layer 3 links. These links establish underlay or transport networks.
Switch fabric physical topology can follow traditional access-distribution-core patterns. There is no requirement to connect switches in leaf-and-spine topology as in data center underlay. Campus networks usually don’t need to accommodate intensive east-west communication as data centers do.
Figure 1. SD-Access Fabric
On top of the underlay, virtual networks are created with the use of VXLAN encapsulation. This is similar to the way how modern data center switch fabrics are built, such as Cisco ACI or native Cisco NX-OS VXLAN fabrics.
Packets on inter-switch links will be encapsulated in UDP on the transport layer and have source and destination IP addresses of Edge device loopbacks called routing locators or RLOCs. Edge nodes are responsible for VXLAN encapsulation/decapsulation when sending and receiving traffic towards fabric.
For broadcast/unknown unicast/multicast or
BUM traffic, underlay can either use headend replication or in newer versions of
SD-Access multicast in underlay can be utilized.
End-user devices connected to downstream
ports of edge switches don’t see any difference from traditional Ethernet
networking. The only exception is fabric access points. They must be attached
to fabric edge nodes and VXLAN encapsulation is extended down to access points.
To deliver a packet, edge nodes sends a query to the control node to determine the target edge’s node IP address (RLOC) using LISP. If a reply is received, the edge node encapsulates traffic into VXLAN datagram and sends it directly to the destination node. If the query cannot be resolved, for example, in the case when the destination is not fabric-attached then traffic is sent to the default border node which in turn performs normal route lookup.
Control Plane
Fabric runs multiple control-plane protocols which can be divided into several categories:
Underlay network protocols
Endpoint ID tracking protocol
External to fabric routing
protocols
WLC-related protocols
Underlay Protocols
The main task of the underlay is to ensure that edge devices can reach each other via their RLOCs or IP addresses that are used in the VXLAN IP header. SD-Access supports automated provisioning with IS-IS and it is recommended for greenfield deployment. It can, however, be replaced with OSPF or EIGRP with manual configuration.
The other protocol that can be used in underlay is a multicast routing protocol to replace resource and bandwidth-intensive headend replication. PIM-SM is the supported protocol.
All switches in the fabric run underlay
protocols. Intermediate routers are similar to P routers in MPLS in the way
that they work only with outer IP packet headers. Therefore, they don’t need to
run or understand any other protocols described in the next sections.
Endpoint ID tracking
Endpoint IDs are IP and MAC addresses of devices connected to edge nodes. The SD-Access control plane is based on the Locator ID Separation Protocol (LISP).
Each designated control plane node performs LISP Map-Server (MS) and Map-Resolver (MR) roles.
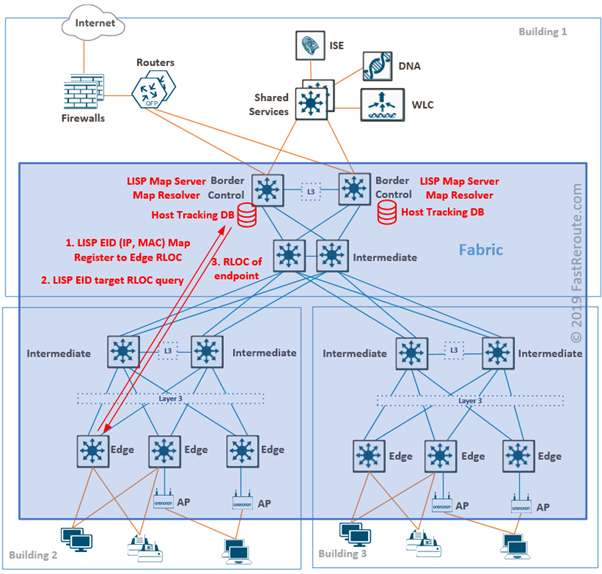
Edge nodes register endpoints by sending Map-Register message to a control plane node. Map-Server stores endpoint ID to edge device information in Host Tracking Database (HTDB).
When the edge node needs to find the address of the edge device behind which specific endpoint is located, it sends a query to Map-Resolver. After checking HTDB, MR sends back RLOC for the requested endpoint.
Control plane and border node functionality can coexist on the same device and each should be deployed on at least two devices for redundancy.
Figure 2. SD-Access Endpoint ID Tracking
External to fabric routing protocols
Control nodes know all endpoints connected to a fabric using the process described above. If an endpoint is not in HTDB and cannot be resolved, the edge node will assume that it is outside of the fabric and forward such traffic to the default fabric border node.
Border nodes connect the fabric to external networks and BGP is the recommended protocol to run on the boundary. Border nodes are also responsible for SGT propagation outside of the fabric.
Figure 3. SD-Access External Connectivity
There are 3 types of border nodes in
SD-Access:
External. Default exit from fabric with no specific routes injection
Internal. Gateway only for a set of networks, such as shared services prefixes
Anywhere. Combination of external and internal functionality
With multiple virtual networks overlaid on top of the SD-Access fabric, isolation on the fabric border is achieved with the use of VRFs.
Access to shared services, such as Cisco DNA Center, WLC controllers, DNS and DHCP servers are required from both underlay and overlay. Such access can be provided by connecting fusion routers to border nodes with VRF-lite. Fusion routers perform route leaking between VRFs to provide reachability information to the shared services from the fabric.
WLC-related protocols
Fabric-integrated WLCs run traditional
control plane protocols, such as CAPWAP tunneling from APs to the WLC. However,
CAPWAP tunnels are not used for data traffic and WLC doesn’t participate in user
traffic forwarding.
When a client connects to a fabric enabled access point, the LISP registration process is different from described above for wired clients. With fabric APs, registration is not performed by the access point or the edge switch. Instead, WLC performs proxy registration with the LISP Map-Server in HTDB. If a wireless client roams, WLC ensures that the LISP mapping is updated.
In this blog post we will explore Cisco ACI fabric components and provide high-level overview of important Cisco ACI Concepts. We will not be looking into configuration workflows, which will be a topic for another post.
ACI (Application Centric Infrastructure) is a multi-tenant data center switching solution based on intent-based approach.
What
is intent-based networking and how it is different from traditional software-defined
networking?
Cisco defines intent-based networking as 3
processes:
Translation, or converting
business requirements into policies
Activation, or transforming a
policy into specific configuration applied to a device
Assurance, or ensuring that the
intent has been realized
Traditional software-defined networking focuses on activation, i.e. orchestration and configuration automation. See Cisco Viptela SD-WAN post to read about Cisco SDN approach for WAN.
Cisco products implement all 3 processes. ACI is responsible for translation and activation. Cisco Tetration and Network Assurance Engine are responsible for assurance aspect.
What
are the benefits of implementing Cisco ACI in the data center?
ACI fabric is centrally managed via single
Web-based management interface. ACI also provides extensive Application
Programming Interface (API), so it can be fully automated.
ACI has multi-tenant design out of the box.
It ensures that tenants are separated not only on data plane, but also by
providing tenant-specific management capability.
Cisco ACI is easy to deploy, as user
doesn’t need to understand or configure fabric protocols, such as VXLAN, underlay
routing protocols or multicast routing. Provisioning of new leaf switches or
replacing existing ones is very simple from discovery to applying
template-based configuration.
There are some new concepts and configuration patterns to master, as ACI is rather different from the way traditional switches are configured and operated. However, ACI brings many benefits with centralized configuration based on templates and policies. For example, consistency across many devices is easily achieved and known working settings can be re-used when new device or tenant is introduced.
Cisco ACI Components
2 main components of ACI are:
Switching Fabric
Controllers
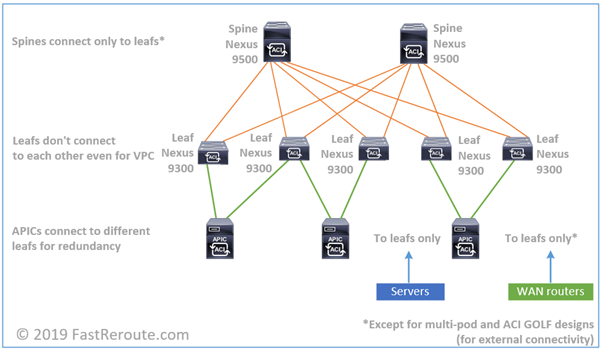
ACI Switching Fabric
Switching fabric is based on leaf-and-spine topology. Each leaf connects to every spine with no direct connections between leafs or spines. Servers, routers for external connectivity, firewalls and other network devices connect to leaf switches only.
Figure 1. ACI Switching Fabric
With two layers there is always a single
hop between any pairs of leaf switches – spine switch layer. Throughput can be
horizontally scaled by introducing additional spine switches. The inter-switch
connections are point-to-point layer-3 links. Therefore, all links can be
evenly utilized with Equal-Cost Multi Pathing (ECMP). Switch fabric utilizes
VXLAN encapsulation or MAC in UDP with Cisco proprietary extensions. Data plane
operation will be explained in the next section in more detail.
Cisco ACI switch portfolio consists of
modular Nexus 9500 and fixed Nexus 9300 families of switches. Not all switches
in these families can run in ACI mode. Some of the switches are NX-OS mode only
and some of them can run in both modes.
ACI Spine Switches
Important: Always check Cisco website for the latest updates and compatibility information.
Switch model
Description
ACI spine/NX-OS
X9736PQ line card
(reached end of sale)
36 x 40G QSFP+
ACI Spine
X9732C-EX line card
32 x 100G QSFP28
Both
X9732C-FX line card
(on roadmap)
32 x 100G QSFP28
Both
X9736C-FX line card
36 x 100G QSFP28
Both
X9336PQ switch
(reached end of sale)
36 x 40G QSFP+
ACI Spine
9332C switch
32 x 40/100G QSFP28
Both
9364C switch
64 x 40/100G QSFP28
Both
9316D-GX switch
16 x 400/100G QSFP-DD
Both
93600CD-GX switch
(on roadmap)
28 x 40/100G QSFP28
and
8 x 400/100G QSFP-DD
Both
Table 1. Cisco ACI Spine Switches
Nexus 9500 family has 3 models of chassis with 4-, 8- and 16- slots for line cards. Each of the models accepts a single or pair of supervisor cards, set of fabric modules and line cards. Fabric modules and line cards is what provides ability of the chassis to run in ACI mode. Currently there are 3 families of line cards:
Cisco and merchant ASICs based.
Only single line card X9736PQ supports ACI spine functionality in this family
and is compatible with C9504-FM, C9508-FM and C9516-FM fabric modules.
R-Series (Deep Buffer). This
family doesn’t provide ACI support and model of its line cards name starts with
X96xx.
Cloud Scale ASICs based. This
more recent family of modules contains ACI spine capable X9732C-EX, X9732C-FX
(roadmap as of Sep 2019), X9736C-FX line cards and C9504-FM-E, C9508-FM-E,
C9508-FM-E2 and C9516-FM-E2 fabric modules
Fixed Nexus 9300 switches that can also be
spine switches are as per list below:
9332C
9364C
9316D-GX
93600CD-GX (roadmap as of Sep
2019)
All of the switches in this list are Cloud
Scale based.
ACI Leaf Switches
Leaf switches are all part of Nexus 9300 family on Cloud Scale technology with the exception of 93120TX. The table below shows available options for ACI leafs.
Switch model
Description
ACI leaf/NX-OS
93120TX
96 x 100M/1/10GBASE-T
and
6 x 40G QSFP+
Both
93108TC-EX
48 x 10GBASE-T
and
6 x 40/100-G QSFP28
Both
93180YC-EX
48 x 10/25G
and
6 x 40/100G QSFP28
Both
93180LC-EX
Up to 32 x 40/50G QSFP+
or
18 x 100G QSFP28
Both
9348GC-FXP
48 x 100M/1GBASE-T,
4 x 10/25G SFP28
and
2 x 40/100G QSFP28
Both
93108TC-FX
48 x 100M/1/10GBASE-T
and
6 x 40/100G QSFP28
Both
93180YC-FX
48 x 1/10/25G fiber ports
and
6 x 40/100G QSFP28
Both
9336C-FX2
36 x 40/100G QSFP28
Both
93216TC-FX2
96 x 100M/1/10GBASE-T
and
12 x 40/100G QSFP28
Both
93240YC-FX2
48 x 1/10/25G fiber ports
and
12 x 40/100G QSFP28
Both
93360YC-FX2
96 x 1/10/25G fiber ports
and
12 x 40/100G QSFP28
Both
9316D-GX
(on roadmap)
16 x 400/100G QSFP-DD
Both
93600CD-GX
28 x 40/100G QSFP28
and
8 x 400/100G QSFP-DD
Both
Table 2. Cisco ACI Leaf Switches
APIC Controllers
The core of ACI deployment is Cisco
Application Policy Infrastructure Controller, or APIC. It is central point for
ACI fabric configuration and monitoring.
APIC is a physical appliance based on Cisco
UCS C-series server. ACI deployment requires at least 3 APIC controllers
forming APIC cluster. The maximum number of APIC controllers in cluster is 5.
For fabric management, each APIC is
physically connected to 2 different leaf switches, with one of the interfaces
as active and the second one as standby. In addition to these 2 links, out-band
connections for CIMC and appliance are required.
Virtual APIC controller can be launched on
VMWare ESXi hypervisor and is component of Cisco Mini ACI fabric for small
scale deployments. In Cisco Mini ACI fabric only single physical APIC is
required, while second and third can be virtualized.
There are 2 APIC configurations currently available – medium and large (more than 1200 edge ports). Appliance must be ordered using published part number and not as C-series server with matching parameters. The configuration details for each the options are shown in the Table 3.
Configuration
Medium
Large
Part number
APIC-M3
APIC-L3
CPU
2 x 1.7 GHz Xeon Scalable 3106/85W 8C/11MB Cache/DDR4 2133M
2 x 2.1 GHz Xeon Scalable 4110/85W 8C/11MB Cache/DDR4 2400MHz
RAM
6 x 16GB DDR4-2666-MHz RDIMM/PC4-21300
12 x 16GB DDR4-2666-MHz RDIMM/PC4-21300
HDD
2 x 1 TB 12G SAS 7.2K RPM SFF HDD
2 x 2.4 TB 12G SAS 10K RPM SFF HDD
CNA
Cisco UCS VIC 1455 Quad Port 10/25G SFP28 CNA PCIE
Cisco UCS VIC 1455 Quad Port 10/25G SFP28 CNA PCIE
Table 3. Cisco APIC Controllers
ACI Fabric Operation
ACI Fabric Forwarding Overview
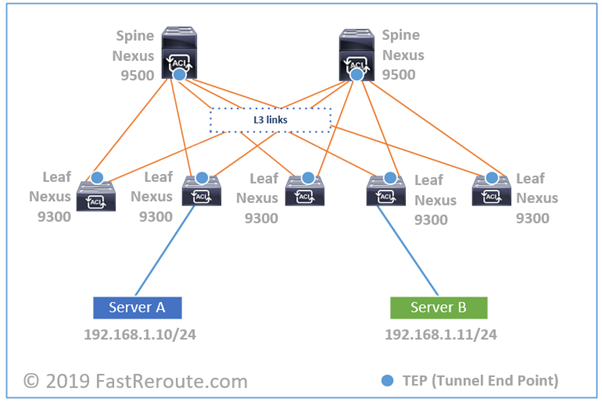
Let’s consider the example topology in the
diagram below. Orange links between leafs and spines are Layer 3. Therefore, no
Layer 2 loops can occur and no Spanning Tree Protocol is required. These links
form underlay network. All data traffic traversing over them is
VXLAN-encapsulated.
If you capture a packet on any of those
links, it will be UDP-encapsulated traffic between loopback interfaces of leaf
switches. This IP address is called TEP for Tunnel End Point. In some
scenarios, the destination IP address can be multicast or spine switches
loopbacks as well.
This UDP traffic is encapsulated payload of
Layer 2 traffic received on downstream interface. Let’s start with Server A
sending IP packet to Server B and to simplify our example, let’s assume it
already knowns MAC address of Server B. Server A will create unicast IP packet,
pack it into Ethernet frame and send it to the switch.
The switch will try to resolve the destination leaf’s TEP IP address. There are several mechanisms available, but let’s assume it knows that it is connected to leaf switch #4. It will take Ethernet frame and pack it into new UDP VXLAN datagram, with new IP header with the source IP as leaf switch #2’s VTEP IP and destination as leaf switch #4’s VTEP IP. Encapsulated traffic will be load-balanced via 2 available spines.
Figure 2. ACI Forwarding
Underlay Protocols
In ACI terminology, underlay or set of
orange links in the diagram above is called Infra VRF. The IP addresses in
underlay are isolated and not exposed to tenants. In contrast, the data traffic
between servers and clients is transferred in overlay networks. It is similar
to how VPNs are built over Internet or Layer 3 VPNs over MPLS network.
The orange links in the Figure 2 run
link-state routing protocol – IS-IS. It’s main purpose is to provide
reachability between Tunnel End Points (TEPs). It is similar to how VXLAN
network is built on Nexus switches using NX-OS, which can run OSPF as routing
protocol instead.
Different to VXLAN EVPN setup, ACI doesn’t run EVPN with BGP to distribute endpoint reachability information. Instead, COOP (Council of Oracle Protocol) is responsible for endpoint information tracking and resolution. MP-BGP, however, is still used to propagate routing information that is external to fabric.
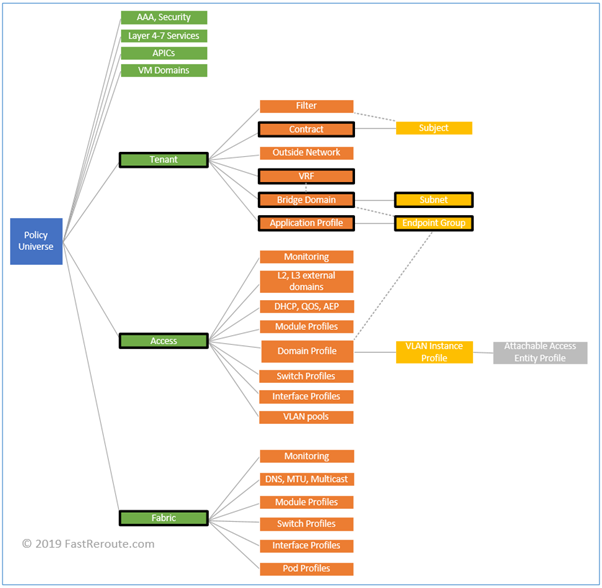
Cisco ACI Basic Concepts
Cisco introduced many new terms with ACI.
All configuration constructs and their interaction is documented in ACI policy
model. Each construct is represented by a Managed Object (MO), which form
hierarchical Management Information Tree (MIT).
Figure 3 displays partial view of the MIT.
Policy Universe on the left is root. Solid lines represent containment and
dotted lines – association. For example, Tenant class contains one or more Bridge
Domain instances and a Bridge Domain is associated with a VRF.
As this post is introductory, we will review some of the terms relevant in context of how fabric works. There are also important terms around how fabric is being configured, however, this will be cover in another post.
Figure 3. ACI Management Information Tree
Tenants
Tenant is a logical grouping of various
policies. It can be a customer or a department within your organization. By
creating different tenants you provide ability to delegate management of
tenant-specific settings.
There are 3 built-in tenants: Infra, Common
and Management. Infra tenant is responsible for fabric underlay, Common tenant
hosts resources that are shared between other tenants and Management tenant is
for in-band and out-of-band configuration.
VRFs
Virtual Routing and Forwarding instance or
VRF has the same meaning as in traditional network, it is a Layer 3 routing
domain. The isolation is achieved by keeping routing information separate.
For example, 2 different VRFs can both have
192.168.0.0/24 network defined in the same way if both had dedicated
non-connected physical networks and routers. By default, VRFs cannot
communicate to each other.
You can export or leak some of the routes
between VRFs, but in this case you need to ensure that the network don’t have
overlapping subnets.
A tenant can have a single or multiple
VRFs.
Bridge Domains and Subnets
Bridge domain is a Layer 2 flood domain. A
VLAN in traditional network is a Layer 2 flood domain. You might be wondering,
why not to keep the same term. One of the reasons, is that fabric uses VXLAN
IDs to differentiate Layer 2 networks between each other. VLAN IDs can be
re-used and even overlap between different ports in recent versions of ACI
software, so they cannot be used as fabric-wide identifiers for a specific
Layer 2 domain.
Bridge domain requires association with VRF
and can contain one or more subnets. It is possible to assign multiple subnets
to a single bridge domain (analogy is a secondary address on SVI) or one to one
relationship between bridge domain and subnet can be established.
Adding a subnet to bridge domain and
enabling unicast routing creates routed interface or SVI in that subnet. In ACI
all leafs are using the same SVI’s IP address for use as default gateway for
the subnet. This functionality is called pervasive gateway (or anycast gateway)
and optimize Layer 3 processing efficiency, as routing is distributed across
all leafs without need to have a central device to perform routing.
Application Profiles and EPGs
Application Profiles are containers for
Endpoint Groups. EPG is a logical group of endpoints and one of the main
components of ACI policy model. Endpoints include physical servers, virtual
machines and other network-connected devices.
EPG membership can be statically
configured, for example, to be based on a specific port and VLAN on it. Or it
can be based on VM’s NIC port group membership via dynamic negotiation with
Virtual Machine Manager.
The policies in ACI are applied to EPGs
and, by default, each EPG is isolated from other EPGs.
Contracts
If one EPG A needs to access services
provided by EPG B, then EPG A is called consumer and EPG B is called provider. Default
behavior in ACI is to block all inter-EPG traffic. Contract must be defined to
facilitate this communication.
Contract consists of subjects which in turn
contain list of filters. Filters are similar to access-lists and contain
entries which match the traffic.
Contracts are directional and differentiate
between traffic going from consumer to provider and traffic in reverse
direction.
Access Policies
Access policies control configuration of interfaces
connecting to physical servers, routers and hypervisors. Objects living under
Access Policies include:
Pools of IDs, or grouping of
VLANs, VXLAN IDs and multicast addresses
Domains and their types define
how devices are connected to leaf switches, for example, physical domain is
used for bare metal servers and VMM domain is used for integration with hypervisors
Interface Policies, Policy
Groups and Profiles. Policy controls specific setting of an interface, which
are grouped together to be used in profile along with interface selector
Switch Policies, Policy Groups
and Profiles. These objects control switch-level configuration and by
associating Interface Profiles with Switch Profiles, interface settings can be
applied to the specific leaf switch
Fabric Policies
Fabric policies and objects under it control internal fabric interface and protocols configuration. For example, parameters such as Fabric MTU is defined by Global Fabric policy and SNMP, date and time parameters are specified by Pod Profiles.
SNMP (Simple Network Management Protocol) defines communication and message format between network management stations and agents.
Every managed network element, such as a router, switch, or host is running a management agent. Its function is to retrieve and modify operational variables’ values as requested by network management stations.
This article contains information on how to enable SNMP agents on different Cisco devices, including IOS, IOS-XE, and NX-OS-based.
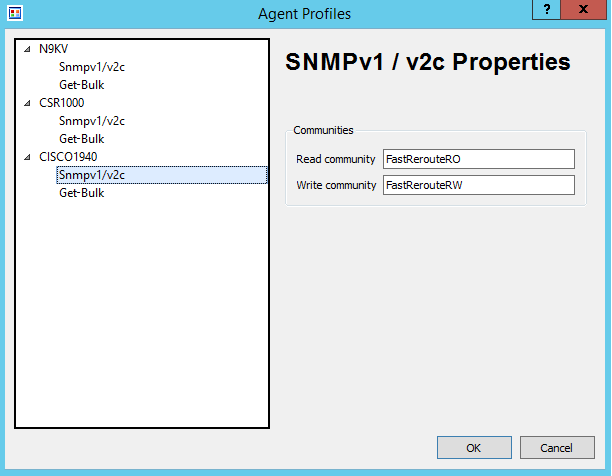
SNMPv1/SNMPv2c Configuration
SNMPv1 and SNMPv2c use the same security mechanisms based on communities transmitted in clear-text format. It is still used in some networks, however, SNMPv3 should be used in new deployments.
I will start with SNMPv1 and SNMPv2 configuration first. SNMPv3 configuration will be shown in the later sections.
I’m using 3 different types of devices in this demonstration: Classic IOS, IOS-XE, and NX-OS. The community string is the only required configuration and it is the same for SNMPv1/v2c on our platforms with slightly different keyword options on NX-OS.
Classic IOS (Cisco 1940)
You can specify if the community string is for read-only and read-write access, as well as access-list to control which management stations are allowed to query the device. All options except for community string are optional, with read-only access being the default if none is specified. You can enter more than one community string, as the command doesn’t overwrite previous community value.
C1940(config)#snmp-server community FastRerouteRO ?
   <1-99>       Std IP accesslist allowing access with this community
                string
   <1300-1999>  Expanded IP accesslist allowing access with this
                community string
   WORD         Access-list name
   ipv6         Specify IPv6 Named Access-List
   ro           Read-only access with this community string
   rw           Read-write access with this community string
   view         Restrict this community to a named MIB view

C1940(config)#snmp-server community FastRerouteRO ro
C1940(config)#snmp-server community FastRerouteRW rw
IOS-XE (CSR1000V)
IOS-XE has the same options and keywords as classic IOS:
CSR1000V(config)#snmp-server community FastRerouteRO ?
   <1-99>       Std IP accesslist allowing access with this community
                string
   <1300-1999>  Expanded IP accesslist allowing access with this
                community string
   WORD         Access-list name
   ipv6         Specify IPv6 Named Access-List
   ro           Read-only access with this community string
   rw           Read-write access with this community string
   view         Restrict this community to a named MIB view

CSR1000V(config)#snmp-server community FastRerouteRO ro
CSR1000V(config)#snmp-server community FastRerouteRW rw
NX-OS (Nexus 9000V)
N9K-1(config)# snmp-server community FastRerouteRO ?

   group        Group to which the community belongs
   ro           Read-only access with this community string
   rw           Read-write access with this community string
   use-ipv4acl  Specify IPv4 ACL, the ACL name specified
                after must be IPv4 ACL.
   use-ipv6acl  Specify IPv6 ACL, the ACL name specified
                after must be IPv6 ACL.

N9K-1(config)#snmp-server community FastRerouteRO ro
N9K-1(config)#snmp-server community FastRerouteRW rw
NMS Configuration
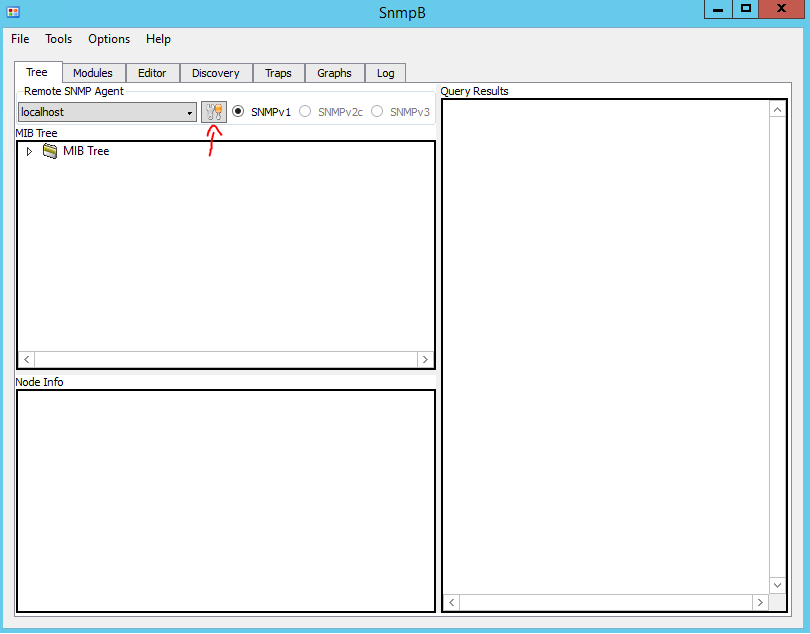
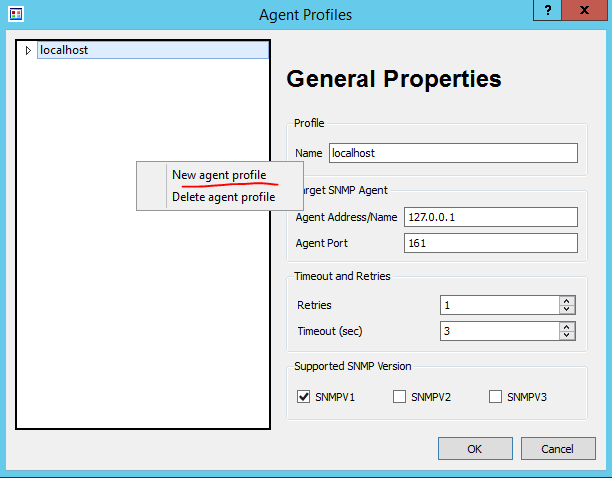
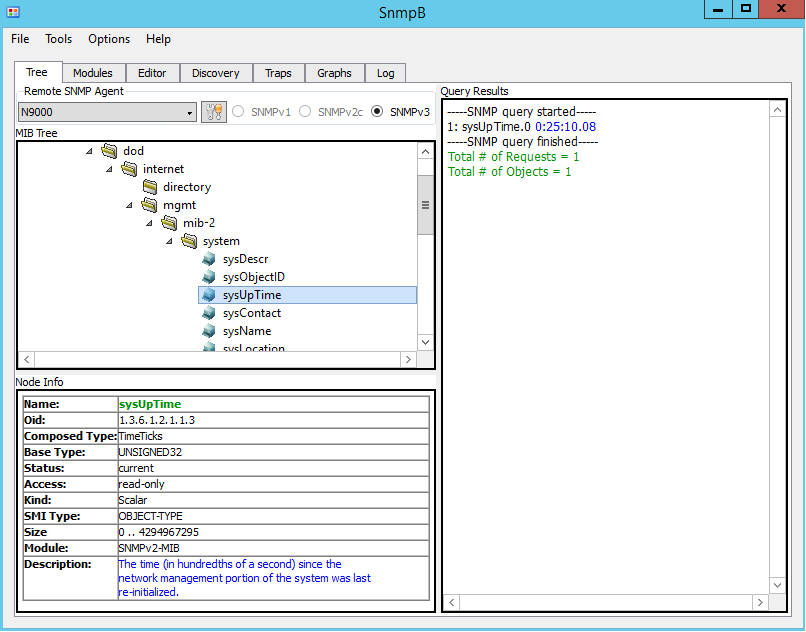
To test the configuration I will be using a great free application called SnmpB (link). For each device, you will require an Agent Profile. Press the Tools button as shown in Figure 1.
Figure 1. SnmpB User InterfaceFigure 2. SnmpB Agent Profile Configuration
I’ve created a
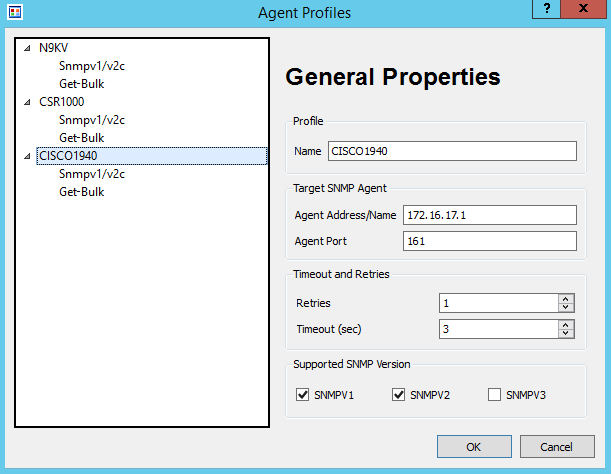
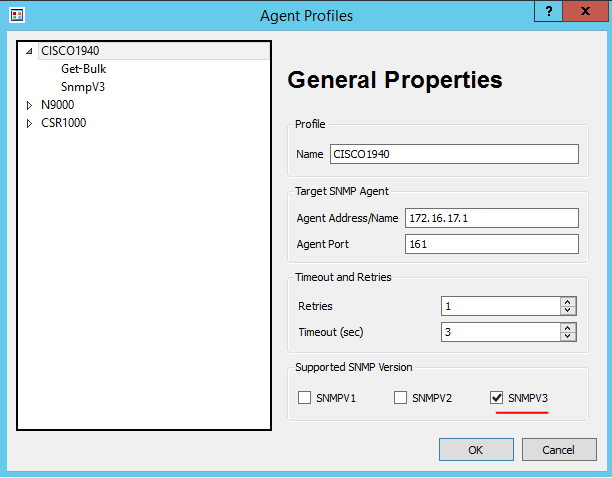
profile for each of the 3 devices. The settings are shown in Figure 3.
My Cisco 1940 router’s IP address is 172.16.17.1 with the SNMP community of FastRerouteRO as shown in Figure 4.
Once profiles are configured, let’s test simple get request for the device uptime. We need to request (using SNMP GET) value of an object that represents device uptime. Any object in SNMP has a unique identifier (OID) and its format and description will be defined in a MIB.
What is MIB and OID?
As per RFC1155 (link) – “Managed objects are accessed via a virtual information store, termed the Management Information Base or MIB… Each type of object (termed an object type) has a name, a syntax, and an encoding. The name is represented uniquely as an OBJECT IDENTIFIER. An OBJECT IDENTIFIER is an administratively assigned name.”
MIB describes a set of objects, including their identifiers, expected reply format, and if values are read-only or can be changed.
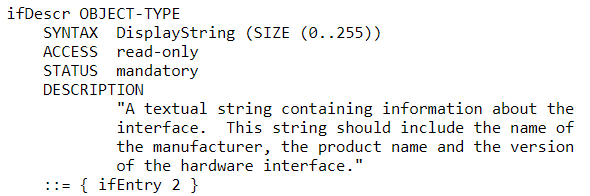
For example, MIB-II has the following definition for interface description:
Figure 5. SNMP Interface Description Object
A network device usually supports a standard-based MIB, such as MIB-II (link), as well as vendor-proprietary MIBs. Most NMS have pre-loaded modules for standard MIBs. Import is required to support vendor-specific extensions.
Object Identifier (OID) is written in dotted notation starting with the top-level node. For example, the Internet subtree of Object Identifiers is 1.3.6.1. The object hierarchy has an unlabelled root. Under root, there are 3 allocated child nodes: ccitt (0), iso (1), and joint-iso-ccitt (2).
ISO has a subtree for other organizations org (3), with the child node of (6) assigned to the US Department of Defense (DOD). DoD in turn allocated a node (1) to Internet Activities Board (IAB).
SNMPv2 Testing
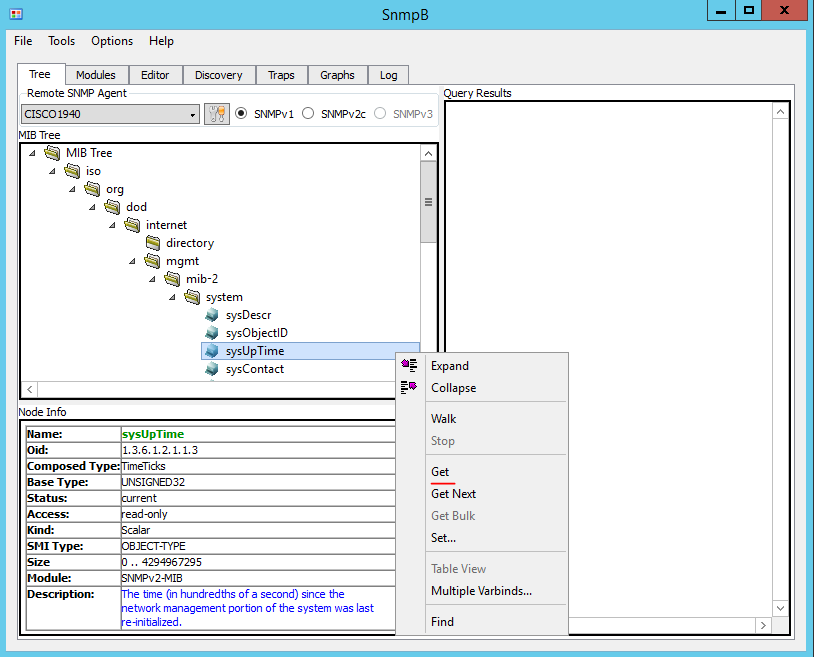
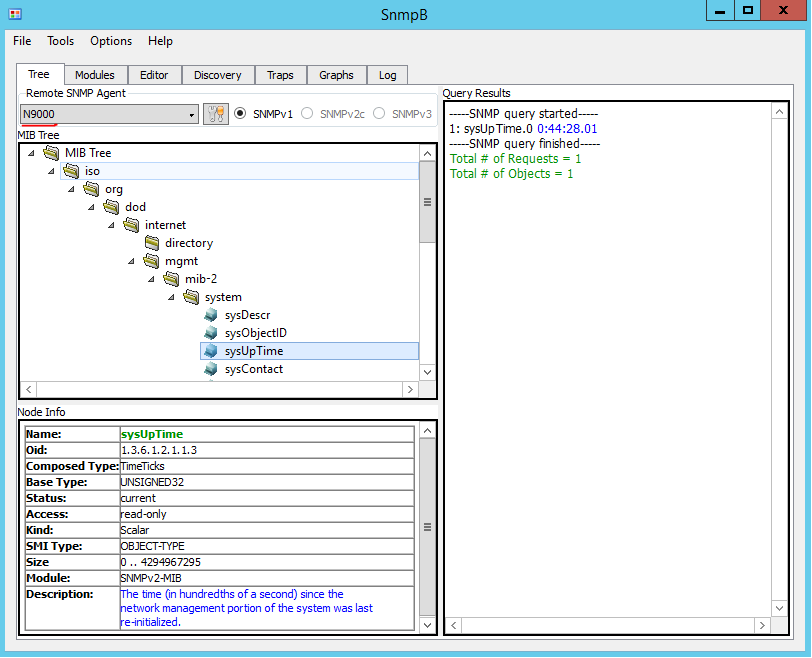
To test – expand the MIB tree and navigate to sysUpTime object (1.3.6.1.2.1.1.3). Note that the Node Info window displays detailed information about the selected object. Right-click on sysUpTime and then select Get.
Figure 6. Get Request for sysUpTime
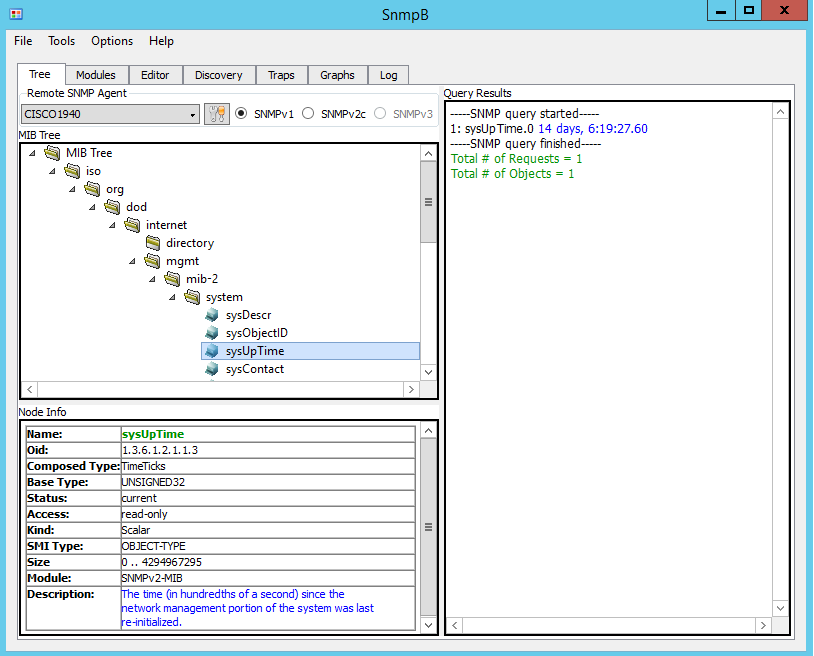
The Figure 7 shows uptime of the Cisco 1940 router.
Figure 7. Reply for sysUpTime (Cisco 1940)
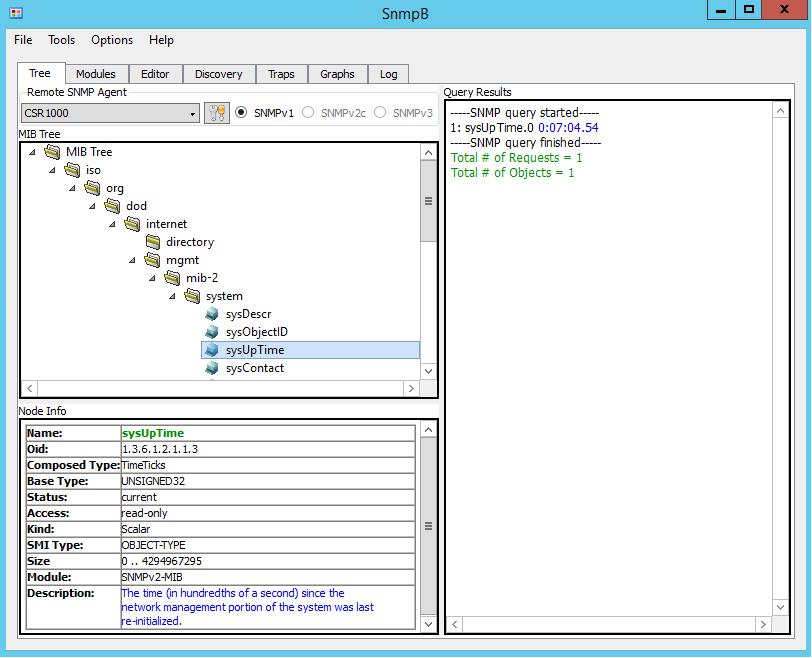
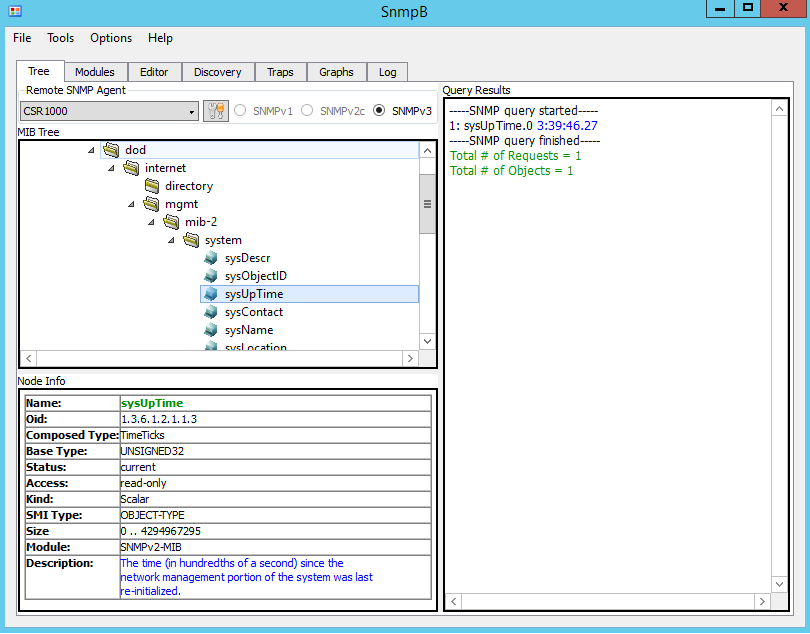
Figure 8 and Figure 9 shows uptime of the Nexus 9000V and CSR. To poll different devices select the corresponding entry in the drop-down box called Remote SNMP Agent.
Figure 8. Reply for sysUpTime (Nexus 9000V) Figure 9. Reply for sysUpTime (CSR1000)
SNMPv3 Configuration
SNMPv3 defines the User-based Security Model (USM) with the ability to authenticate and encrypt communication between agents and monitoring stations. There are 3 security levels listed below with the weakest first: • noAuthNoPriv (no authentication or encryption) • authNoPriv (authentication only) • authPriv (authentication and encryption)
Minimal configuration of SNMPv3 requires 2 components: Group and User.
Note: There are some interoperability issues between Cisco IOS and IOS-XE devices and SnmpB when AES192 and AES256 used, so AES128 is configured instead in all examples. SNMP debug (debug snmp detail and debug snmp packets) produce the following error with AES192 and AES256:
*Dec 26 02:47:55.691: SNMP: Packet received via UDP from 172.16.17.75 on GigabitEthernet1no such type in ParseType (152) (0x98)
  ParseSequence, Unexpected type: FFFFFFFFFFFFFFFF
  SrParseV3SnmpMessage: ParseSequence:
  SrParseV3SnmpMessage: Failed.
  SrDoSnmp: ASN Parse Error
 *Dec 26 02:47:58.693: SNMP: Packet received via UDP from 172.16.17.75 on GigabitEthernet1no such type in ParseType (152) (0x98)
 ParseSequence, Unexpected type: FFFFFFFFFFFFFFFF
 SrParseV3SnmpMessage: ParseSequence:
 SrParseV3SnmpMessage: Failed.
 SrDoSnmp: ASN Parse Error
Classic IOS (Cisco 1940)
C1940(config)#snmp-server group SNMP-Group v3 ?
   auth    group using the authNoPriv Security Level
   noauth  group using the noAuthNoPriv Security Level
   priv    group using SNMPv3 authPriv security level

C1940(config)#snmp-server group SNMP-Group v3 priv
C1940(config)#snmp-server user SNMP-Admin SNMP-Group v3
              auth sha FastReroute priv aes 128 FastReroute
Note: SNMP users are not stored as part of running or startup configuration, so the second line will not be visible via “show running-config“.
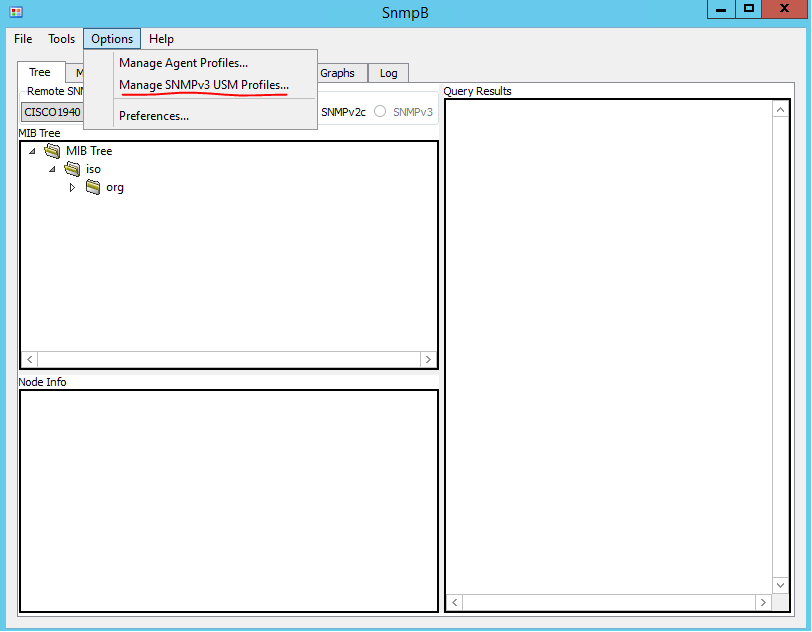
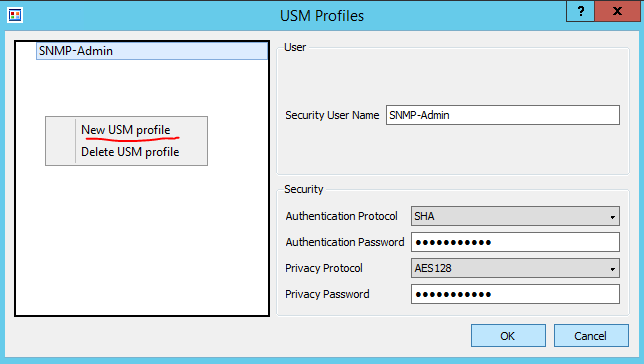
SnmpB requires the configuration of SNMPv3 User. To access the configuration setting click on Options > Manage SNMPv3 USM Profile. Once the USM profile window opens, right-click on a blank space in the list of profiles and select “New USM profile”. I’ve configured username, security parameters to match the ones we configured on the router earlier. See Figures 9 and 10 for details.
Figure 9. SnmpB: SNMP User ConfigurationFigure 10. SnmpB: SNMP User Configuration – 2
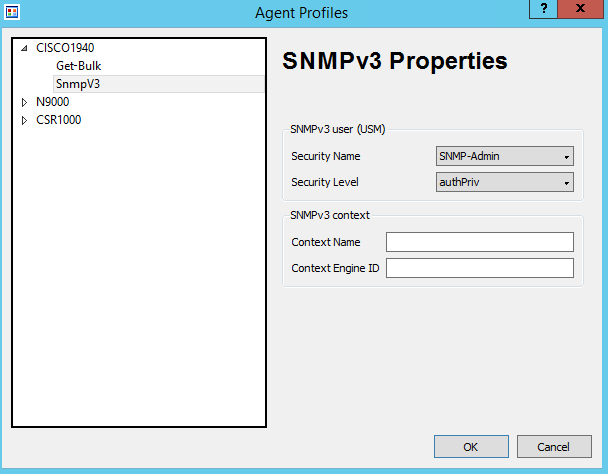
Go back to our device profiles, as shown in the Figure 1. Select SNMPv3 as supported version and choose corresponding Security Name and Levels as shown in Figure 11 and 12.
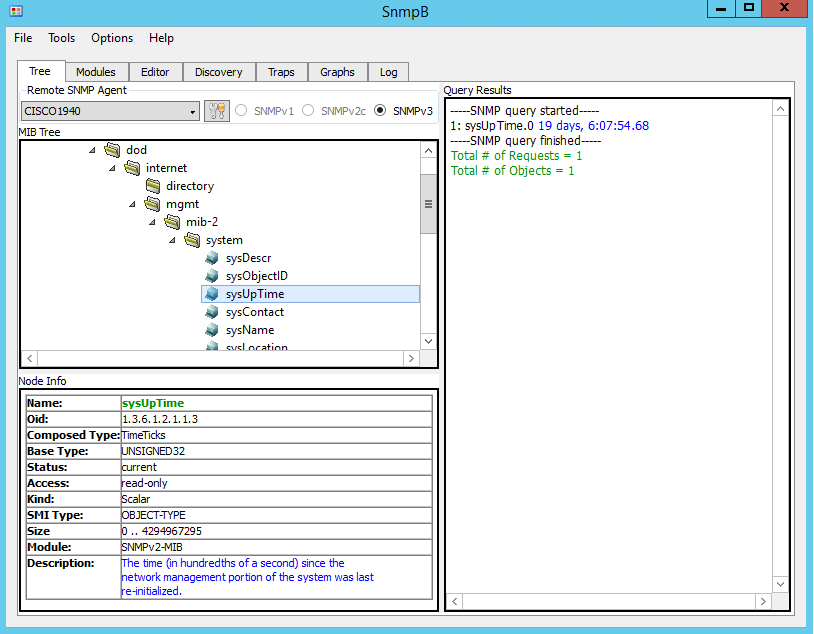
Let’s try to poll the Cisco 1940 to confirm that we still can access uptime information as shown in Figure 13.
Figure 13. SnmpB: Poll Uptime with SNMPv3 Enabled (Cisco 1940)
IOS-XE (CSR1000V)
IOS-XE is configured identically as Classic IOS.
CSR1000V(config)#snmp-server group SNMP-Group v3 priv
CSR1000V(config)#snmp-server user SNMP-Admin SNMP-Group v3
                 auth sha FastReroute priv aes 128 FastReroute
Figure 14. SnmpB: Poll Uptime with SNMPv3 Enabled (CSR1000)
NX-OS (Nexus 9000V)
Nexus 9000V minimal configuration is based on a single string, as SNMP groups in NX-OS are replaced by roles for Role-Based Access Control, and by default new users will be assigned network-operator permissions. As a side effect, by default SNMP users will be able to log-in via CLI to the switch with access to all show commands.
Note that there is no group option under SNMP. Use the “role” set of commands, which then can be used as groups in SNMP.
N9K-1(config)# snmp-server ?
   aaa-user           Set duration for which aaa-cached snmp user
                      exists
   community          Set community string and access privs
   contact            Modify sysContact
   context            SNMP context to be mapped
   counter            Configure port counter configuration
   drop               Silently drop unknown v3 user packets
   enable             Enable SNMP Traps
   engineID           Configure a local SNMPv3 engineID
   globalEnforcePriv  Globally enforce privacy for all the users
   host               Specify hosts to receive SNMP notifications
   location           Modify sysLocation
   mib                Mib access parameters
   packetsize         Largest SNMP packet size
   protocol           Snmp protocol operations
   source-interface   Source interface to be used for sending out SNMP
                      notifications
   system-shutdown    Configure snmp-server for reload(2)
   tcp-session        Enable one time authentication for snmp over tcp
                      session.
   user               Define a user who can access the SNMP engine
You can assign users to a group for SNMP-Admin by typing it in straight after the username.
N9K-1(config)# snmp-server user SNMP-Admin ?

   WORD         Group name (ignored for notif target user) (Max Size
                28)
   auth         Authentication parameters for the user
   enforcePriv  Enforce privacy for the user
   use-ipv4acl  Specify IPv4 ACL, the ACL name specified after must be
                IPv4 ACL.
   use-ipv6acl  Specify IPv6 ACL, the ACL name specified after must be
                IPv6 ACL.

N9K-1(config)# snmp-server user SNMP-Admin auth
               sha FastReroute priv aes-128 FastReroute
NX-OS also creates a normal user in addition to the SNMP user. Both users are stored in the running configuration.
N9K-1(config)# show run | incl SNMP
username SNMP-Admin password 5 #password# role network-operator
Figure 15. SnmpB: Poll Uptime with SNMPv3 Enabled (Nexus 9000V)
SNMP show commands
Classic IOS (Cisco 1940) and IOS-XE (CSR1000V)
Devices keep track of which objects were polled and associated timestamps, as shown in the listings below.
CSR1000V#show snmp stats oid

time-stamp               #of times requested             OID
 03:27:46 UTC Dec 21 2018         6                       sysUpTime
 09:54:49 UTC Dec 18 2018         3                       system.6
 09:54:46 UTC Dec 18 2018         3                       system.4
 09:53:49 UTC Dec 18 2018         2                       system.5
 09:53:49 UTC Dec 18 2018         2                       system.1
 11:27:41 UTC Dec 17 2018         1                       sysOREntry.3
To get the list of SNMP groups use the “show snmp group” command. Note that SNMPv1 and SNMPv2c have groups and as there is no concept of users, they are named as the community name. Also not covered in this article, SNMP views allow restricting access only to specific OIDs or subtrees.
CSR1000V#show snmp group groupname: ILMI security model:v1 contextname: storage-type: permanent readview : *ilmi writeview: *ilmi notifyview: row status: active
To get the list of SNMP users use the “show snmp user” command. As users are not displayed in the configuration, this command is the only way to check the SNMP users.
CSR1000V#show snmp user
User name: SNMP-Admin
 Engine ID: 800000090300000C29B86282
 storage-type: nonvolatile        active
 Authentication Protocol: SHA
 Privacy Protocol: AES128
 Group-name: SNMP-Group
NX-OS (Nexus 9000V)
N9K-1# show snmp oid-statistics

 SNMP OID Stats -
 Object ID                                  Min    Max    Avg
 Max Access TS                          Last-polled NMS  Poll Count
                                           (ms)   (ms)   (ms)

 iso.3.6.1.2.1.1.3                           <1     <1     <1
 02:33:25:515 Dec 21 2018             172.16.17.75          1
NX-OS in addition to OID statistics also provides show command to display statistics related to a management station.
N9K-1# show snmp nms-statistics

 - SNMP NMS OID Stats -

 NMS IP Address                              GET    GET    GET    SET
 First Poll                 Last Poll
                                                   NEXT   BULK
 --------------------------------------------------------------------------------
 ----------------------------------------
 172.16.17.75                                  1      0      0      0
 02:33:25:515 Dec 21 2018  02:33:25:515 Dec 21 2018
To get the list of SNMP groups use the “show snmp group” command. Its output is the same as the “show role” command would produce.
N9K-1(config)# show snmp group

Role: aaa-db-admin
   Description: Predefined AAA DB admin, has no cli permissions. Allows RESTful A
 PI

 Rule    Perm    Type        Scope               Entity

 1       permit  read-write

 #some output omitted

 Role: network-admin
   Description: Predefined network admin role has access to all commands
   on the switch

 Rule    Perm    Type        Scope               Entity

 1       permit  read-write
 Role: network-operator
   Description: Predefined network operator role has access to all read
   commands on the switch

 Rule    Perm    Type        Scope               Entity

 1       permit  read

 #some output omitted
To get the list of SNMP users use the “show snmp user” command. Admin users are automatically enabled as SNMP users, as NX-OS implements a single user and role storage.
N9K-1(config)# show snmp user SNMP USERS
User Auth Priv(enforce) Groups acl_filter _ ___ ___ admin md5 des(no) network-admin SNMP-Admin sha aes-128(no) network-operator
NOTIFICATION TARGET USERS (configured for sending V3 Inform)
User Auth Priv _ ___
SNMP debug commands
Classic IOS (Cisco 1940) and IOS-XE (CSR1000V)
Two commands displaying if there is communication with NMS are “debug snmp detail” and “debug snmp packets“. Below is the output generated when a simple SNMP Get request is performed.
CSR1000V#debug snmp detail
 SNMP Detail Debugs debugging is on
CSR1000V#debug snmp packets
 SNMP packet debugging is on
CSR1000V#terminal monitor
 *Dec 26 23:41:59.539: SNMP: Packet received via UDP from 172.16.17.75 on GigabitEthernet1SrParseV3SnmpMessage: Failed..


*Dec 26 23:41:59.539: SNMP: Get request, reqid 1062, errstat 0, erridx 0
  sysUpTime.0 = NULL TYPE/VALUESrDoSnmp: received get pdu
 CheckClassMIBView: all included
 CheckMIBView: OID is in MIB view.

*Dec 26 23:41:59.539: SNMP: Response, reqid 1062, errstat 0, erridx 0
  sysUpTime.0 = 305892
 *Dec 26 23:41:59.540: SNMP: Packet sent via UDP to 172.16.17.75
NX-OS (Nexus 9000V)
In NX-OS use “debug snmp pkt-dump” which is similar to commands shown above for IOS/IOS-XE. Below is the output generated when a simple SNMP Get request is performed.
In this blog post I will summarize available information on Cisco ISR and ASR performance. The following platforms will be covered: ISR G2, ISR 1100, ISR 4000, ASR 1000.
Update: check my new article on SD-WAN routers and platforms here.
ISR G2
Let’s start with ISR G2 performance numbers. ISR G2s are legacy products with Classic IOS, however, they are still around and it is important to know how they perform to properly size newer replacement routers.
Important: These are not real-world numbers. Please read further.
Model
Packets Per Second
Megabits Per Second
Cisco 860
25,000
197
Cisco 880
50,000
198
Cisco 890
100,000
1,400
Cisco 1921
290,000
2,770
Cisco 1941
330,000
2,932
Cisco 2901
330,000
3,114
Cisco 2911
352,000
3,371
Cisco 2921
479,000
3,502
Cisco 2951
579,000
5,136
Cisco 3925
833,000
6,903
Cisco 3925E
1,845,000
6,703
Cisco 3945
982,000
8,025
Cisco 3945E
2,924,000
8,675
Table 1. Cisco ISR G2 RFC 2544 Performance
The second column displays the number of packets per second that the platform can forward under maximum CPU utilization just before starting to drop the packets. For a router’s CPU it takes the same amount of effort to route the 64-byte packet as it would take for 1500-byte one. So it is usually a more reliable metric that removes packet size from the equation.
The third column displays the value in bytes per second (i.e. packet size in bytes x packets per second). As the results can differ more than 20x times based on the size of the packets selected, the specification must provide average packet size that was used during the test.
What is IMIX? The traffic doesn’t consist of packets of the same size, many tests are using packets of different sizes (called Internet Mix (IMIX)). For example, in a simple IMIX sample in every 12 packets transmitted – 7 will be 40 bytes long, 4 – 576, and 1 – 1500. The average packet size in this case will be 340 bytes.
Values provided in Table 1 are based only on IP packet routing without any additional processing, such as QoS, encryption, or NAT, so it is a maximum performance that a platform can deliver. The real-world number will be significantly smaller.
Another important thing to note is how a packet is counted, for example, it can be counted twice – as it enters an ingress interface and exits egress one. Cisco counts this is as a single packet, as it is seen by the forwarding engine. On the other hand, to select a router for a specific WAN interface bandwidth utilization in each direction must be added. For example, in the case of 10Mbps WAN with expected 9Mbps download and 3Mbps upload – calculation should be based on 12Mbps of the load.
For G2 platforms Cisco recommended WAN-link based sizing is as per the table below. Values are much smaller compared to normal IP forwarding. It is also expected that the router will not be running at 99% CPU and will be dropping packets.
Platform
WAN Link
860
4
880
8
890
15
1921
15
1941
25
2901
25
2911
35
2921
50
2951
75
3925
100
3945
150
3925E
250
3945E
350
Table 2. ISR G2 Recommended Sizing Based on WAN Link Speed
ISR 4000
ISR 4000s are running IOS-XE and have introduced performance-based licensing with 3 tiers:
Default
Performance (x2-3 of default throughput level)
Boost (removes shaping completely)
Cisco publishes the following statistics for basic IP routing without services with IMIX traffic (~330 bytes packets).
*- bottleneck was the physical interface speed, not forwarding CPU
As the routers are capable to forward significantly more traffic than default and performance license allows, the numbers in table 3 for these license tiers are close to real-life when services are getting added. It is safe to choose ISR 4000 with “factory default” and “performance” levels and in most cases lower models with a “performance” license if you plan to use multiple services.
Recently added boost license removes shaping completely. Table 3 displays PPS values for ISR 4000, however, most of the routers didn’t have high CPU utilization, as the bottleneck was at the interface clock speed. The calculation is based on an IMIX size of 330 Bytes.
The data provided should be used as an only approximation, as there are many variables that can affect actual device performance which also will not scale linearly with CPU load increase.
ISR 1100
ISR 1100 is a new branch office platform running IOS-XE and similar to Cisco 890 and 1921. Published performance numbers are listed in Table 4. IP forwarding of ISR 1100 is comparable to ISR 4221 with a boost license. Note that ISR 1100 doesn’t support voice features.
Platform
RFC-2544
(Mbps, IMIX)
RFC-2544
(pps, IMIX)
Encryption
(Mbps, AES 256, IMIX)
NAT (Mbps, IMIX)
ACL + NAT + HQoS (Mbps, IMIX)
C1100-4P
1,252
475,000
230
660
330
C1100-8P
1,750
660,000
335
960
510
Table 4. ISR 1100 Performance
ASR 1000
In the cases when you need more than 10Gbps of throughput provided by ISR 4461, ASR 1000 will be the platform of choice. All models in the ASR 1000 range have 2 dedicated hardware components – RP (Route Processor) and ESP (Embedded Service Processor). RP is responsible for control-plane operations and ESP for data forwarding.
Lower-end models, such as ASR1001-X and ASR1002-X have RP and ESP integrated into chassis. The throughput of the system depends on ESP, which runs Cisco-proprietary programmable ASICs called Quantum Flow Processor (QFP).
The performance of 3 integrated models is shown in Table 5. For the models presented in Table 5, an incremental throughput license is required.
Model
ESP Bandwidth (Mbps)
Throughput (pps)
ASR1001-X
20,000
19,000,000
ASR1002-X
30,000
36,000,000
ASR1002-HX
100,000
58,000,000
Table 5. ASR 1000 Performance (integrated ESP models)
Related Links
RFC-2544: Provides information on recommended way to perform testing
To configure IPv6 in IOS, as with IPv4, addresses need to be assigned to interfaces. You can assign a single link-local address and multiple global addresses. In comparison to IPv4, IPv6 unicast routing is disabled by default and needs to be globally enabled.
Figure 1. Link-Local Address Configuration
First, we will use a command that automatically generates link-local address for the interface.
Let’s check what IPv6 address has been allocated by IOS.
R01
R01#show ipv6 interface
GigabitEthernet3 is up, line protocol is up
  IPv6 is enabled, link-local address is FE80::20C:29FF:FEB8:6296
  No Virtual link-local address(es):
  No global unicast address is configured
  Joined group address(es):
    FF02::1
    FF02::1:FFB8:6296
As the listing shows, the link-local address has been automatically assigned. It is derived from the MAC address of the interface displayed in the listing below.
R01
R01#show interface GigabitEthernet3
GigabitEthernet3 is up, line protocol is up
  Hardware is CSR vNIC, address is 000c.29b8.6296 (bia 000c.29b8.6296)
The interface has automatically joined 2 multicast groups – FF02::1, which is the all-nodes address, and solicited-node for this address -FF002::1:FFB8:6296.
See the details on different addresses format and how they are derived in this blog post.
Let’s manually assign the link-local address, so it is not modified EUI-64 based. “ipv6 enable” command can be removed in this case, as its purpose is to just allocate a link-local address. For link-local addresses, no prefix-length needs to be specified, as it has a fixed format.
R01
R01#show ipv6 interface
GigabitEthernet3 is up, line protocol is up
  IPv6 is enabled, link-local address is FE80::1
  No Virtual link-local address(es):
  No global unicast address is configured
  Joined group address(es):
    FF02::1
    FF02::1:FF00:1
Notice the new link-local address and solicited-node multicast group addresses.
The next example demonstrates that only one single link-local address is allowed. If a new address is typed in it will overwrite the previous one.
IOS automatically assigns link-local addresses as soon as you configure IPv6 address on the interface. In most cases, you will start your configuration with allocating addresses from global unicast or unique local ranges.
Diagram 2 shows lab topology that we will be using in the next examples.
Figure 2. IPv6 Lab Topology
First let’s configure R1’s interface and verify it’s settings.
R01
R01(config)#interface GigabitEthernet 2.123
R01(config-subif)#encapsulation dot1Q 123
R01(config-subif)#ipv6 address 2001:0:0:123::1/64
R01(config-subif)#end
R01#show ipv6 interface Gi2.123
GigabitEthernet2.123 is up, line protocol is up
  IPv6 is enabled, link-local address is FE80::20C:29FF:FEB8:628C
  No Virtual link-local address(es):
  Global unicast address(es):
    2001:0:0:123::1, subnet is 2001:0:0:123::/64
  Joined group address(es):
    FF02::1
    FF02::1:FF00:1
    FF02::1:FFB8:628C
IOS automatically assigned a link-local address. The global unicast address is now assigned and the interface has joined the corresponding solicited-node multicast group – FF02::1:FF00:1.
The similar configuration is now applied to the remaining routers.
Let’s now test connectivity to confirm that we can reach routers on the same segment. As in IPv4, the ping command recognizes IPv6 address format.
R01
R01#ping 2001:0:0:123::3
Type escape sequence to abort.
Sending 5, 100-byte ICMP Echos to 2001:0:0:123::3, timeout is 2 seconds:
…..
Success rate is 0 percent (0/5)
R01#ping 2001:0:0:123::2
Type escape sequence to abort.
Sending 5, 100-byte ICMP Echos to 2001:0:0:123::2, timeout is 2 seconds:
…..
Success rate is 0 percent (0/5)
The connectivity will not work without enabling ipv6 unicast-routing globally, as it is disabled by default in the version of IOS used in this example. Future versions most likely will have it enabled by default.
R01#ping 2001:0:0:123::2
Type escape sequence to abort.
Sending 5, 100-byte ICMP Echos to 2001:0:0:123::2, timeout is 2 seconds:
!!!!!
Success rate is 100 percent (5/5), round-trip min/avg/max = 1/1/1 ms

R01#ping 2001:0:0:123::3
Type escape sequence to abort.
Sending 5, 100-byte ICMP Echos to 2001:0:0:123::3, timeout is 2 seconds:
!!!!!
Success rate is 100 percent (5/5), round-trip min/avg/max = 1/1/1 ms
R01#
Similar to the “show ip arp” command that displays IP-to-ARP information, in the IPv6 world, there is a “show ipv6 neighbors” command.
R01
R01#show ipv6 neighbors
IPv6 Address                              Age Link-layer Addr State Interface
2001:0:0:123::2                             0 000c.29ae.3524  REACH Gi2.123
2001:0:0:123::3                             0 000c.29fe.c0ba  REACH Gi2.123
FE80::20C:29FF:FEAE:3524                    1 000c.29ae.3524  STALE Gi2.123
FE80::20C:29FF:FEFE:C0BA                    1 000c.29fe.c0ba  STALE Gi2.123
IOS provides another command that can automatically derive the host portion (modified EUI-64) of IPv6 address based on its MAC address. For readability, I’ve assigned the host portion of the address to match the router name. Each interface in IPv6 can have multiple global unicast addresses, so let’s assign the second address to R01.
R01#show ipv6 interface
GigabitEthernet2.123 is up, line protocol is up
  IPv6 is enabled, link-local address is FE80::20C:29FF:FEB8:628C
  No Virtual link-local address(es):
  Global unicast address(es):
    2001:0:0:123::1, subnet is 2001:0:0:123::/64
    2001::123:20C:29FF:FEB8:628C, subnet is 2001:0:0:123::/64 [EUI]
  Joined group address(es):
    FF02::1
    FF02::2
    FF02::1:FF00:1
    FF02::1:FFB8:628C
Notice that the router now has 2 IP addresses allocated. As both global addresses share the same last 24-bits, they are mapped to the same solicited-node multicast group – FF02::1:FFB8:628C.
Static Routes Configuration
To enable full reachability we will setup static IPv6 routes. R3 knows about both networks, as it has directly attached interfaces in 2001:0:0:123::/64 and 2001:0:0:34::/64. All other routers require a single static route to a remote subnet. First, let’s configure the static route for R1.
Notice that the route has interface and next-hop information. This type of static route is called a fully specified static route. The next-hop address must be directly attached to the interface. The interface can be omitted, in which case the router will do a lookup to identify the egress interface for the next-hop address. This is called a recursive route lookup. With recursive routes, next-hop is not required to be directly attached.
Let’s check the resulting routing table using the “show ipv6 route” command to confirm that the static route is now present.
R01
R01#show ipv6 route
IPv6 Routing Table - default - 5 entries
Codes: C - Connected, L - Local, S - Static, U - Per-user Static route
       B - BGP, R - RIP, H - NHRP, I1 - ISIS L1
       I2 - ISIS L2, IA - ISIS interarea, IS - ISIS summary, D - EIGRP
       EX - EIGRP external, ND - ND Default, NDp - ND Prefix, DCE - Destination
       NDr - Redirect, RL - RPL, O - OSPF Intra, OI - OSPF Inter
       OE1 - OSPF ext 1, OE2 - OSPF ext 2, ON1 - OSPF NSSA ext 1
       ON2 - OSPF NSSA ext 2, la - LISP alt, lr - LISP site-registrations
       ld - LISP dyn-eid, lA - LISP away, a - Application
S   2001:0:0:34::/64 [1/0]
     via 2001:0:0:123::3, GigabitEthernet2.123
C   2001:0:0:123::/64 [0/0]
     via GigabitEthernet2.123, directly connected
L   2001:0:0:123::1/128 [0/0]
     via GigabitEthernet2.123, receive
L   2001::123:20C:29FF:FEB8:628C/128 [0/0]
     via GigabitEthernet2.123, receive
L   FF00::/8 [0/0]
     via Null0, receive
Reachability to remote subnet now works, as shown in the next listing. As R4 doesn’t have a static route for return traffic at this stage, it is still not reachable.
R01
R01#ping 2001:0:0:34::3
Type escape sequence to abort.
Sending 5, 100-byte ICMP Echos to 2001:0:0:34::3, timeout is 2 seconds:
!!!!!
Success rate is 100 percent (5/5), round-trip min/avg/max = 1/1/5 ms
R01#ping 2001:0:0:34::4
Type escape sequence to abort.
Sending 5, 100-byte ICMP Echos to 2001:0:0:34::4, timeout is 2 seconds:
…..
Success rate is 0 percent (0/5)
As the next step, we will configure all remaining routers. R4 has connectivity only via R3 and is called stub router, so it will have an only default route configured instead of a specific route.
To see detailed debug-level information on neighbor discovery we will use the “debug ipv6 nd” command. All debug commands must be used with care in aproduction environment, as they can cause performance degradation and in some cases can overload the router’s CPU.
In the example below, R01 doesn’t have information about R02’s MAC address. Debug shows that R1 sends Neighbor Solicitation messages and in response gets Neighbor Advertisement message with Link-Local Address (LLA) of R02. Debug also shows that after the exchange of Global Unicast information completed routers exchange link-local IPv6 information.
R01
R01#show ipv6 neighbors
IPv6 Address                              Age Link-layer Addr State Interface
2001:0:0:123::3                             1 000c.29fe.c0ba  STALE Gi2.123
FE80::20C:29FF:FEFE:C0BA                    1 000c.29fe.c0ba  STALE Gi2.123
R01#debug ipv6 nd
  ICMP Neighbor Discovery events debugging is on
  ICMP ND HA events debugging is ON
R01#terminal monitor
R01#
R01#ping 2001:0:0:123::2
Type escape sequence to abort.
Sending 5, 100-byte ICMP Echos to 2001:0:0:123::2, timeout is 2 seconds:
!!!!!
Success rate is 100 percent (5/5), round-trip min/avg/max = 1/3/14 ms
R01#
*Nov 18 00:08:01.516: ICMPv6-ND: (GigabitEthernet2.123,2001:0:0:123::2) DELETE -> INCMP
*Nov 18 00:08:01.519: ICMPv6-ND: (GigabitEthernet2.123,2001:0:0:123::2) Sending NS
*Nov 18 00:08:01.519: ICMPv6-ND: (GigabitEthernet2.123,2001:0:0:123::2) Queued data for resolution
*Nov 18 00:08:01.524: ICMPv6-ND: (GigabitEthernet2.123,2001:0:0:123::2) Received NA from 2001:0:0:123::2
*Nov 18 00:08:01.524: ICMPv6-ND: Validating ND packet options: valid
*Nov 18 00:08:01.524: ICMPv6-ND: (GigabitEthernet2.123,2001:0:0:123::2) LLA 000c.29ae.3524
*Nov 18 00:08:01.524: ICMPv6-ND: (GigabitEthernet2.123,2001:0:0:123::2) INCMP -> REACH
*Nov 18 00:08:01.528: ICMPv6-ND: (GigabitEthernet2.123,2001:0:0:123::1) Received NS from 2001:0:0:123::2
*Nov 18 00:08:01.528: ICMPv6-ND: Validating ND packet options: valid
*Nov 18 00:08:01.528: ICMPv6-ND: (GigabitEthernet2.123,2001:0:0:123::1) Sending NA to 2001:0:0:123::2
*Nov 18 00:08:06.586: ICMPv6-ND: (GigabitEthernet2.123,FE80::20C:29FF:FEB8:628C) Received NS from FE80::20C:29FF:FEAE:3524
*Nov 18 00:08:06.586: ICMPv6-ND: Validating ND packet options: valid
*Nov 18 00:08:06.586: ICMPv6-ND: (GigabitEthernet2.123,FE80::20C:29FF:FEAE:3524) Glean
*Nov 18 00:08:06.586: ICMPv6-ND: (GigabitEthernet2.123,FE80::20C:29FF:FEAE:3524) LLA 000c.29ae.3524
*Nov 18 00:08:06.586: ICMPv6-ND: (GigabitEthernet2.123,FE80::20C:29FF:FEAE:3524) INCMP -> STALE
*Nov 18 00:08:06.587: ICMPv6-ND: (GigabitEthernet2.123,FE80::20C:29FF:FEB8:628C) Sending NA to FE80::20C:29FF:FEAE:3524
*Nov 18 00:08:06.588: ICMPv6-ND: (GigabitEthernet2.123,FE80::20C:29FF:FEAE:3524) STALE -> DELAY
*Nov 18 00:08:11.649: ICMPv6-ND: (GigabitEthernet2.123,FE80::20C:29FF:FEAE:3524) DELAY -> PROBE
*Nov 18 00:08:11.650: ICMPv6-ND: (GigabitEthernet2.123,FE80::20C:29FF:FEAE:3524) Sending NS
*Nov 18 00:08:11.651: ICMPv6-ND: (GigabitEthernet2.123,FE80::20C:29FF:FEAE:3524) Received NA from FE80::20C:29FF:FEAE:3524
*Nov 18 00:08:11.651: ICMPv6-ND: Packet contains no options
*Nov 18 00:08:11.652: ICMPv6-ND: Validating ND packet options: valid
*Nov 18 00:08:11.652: ICMPv6-ND: Packet contains no options
*Nov 18 00:08:11.652: ICMPv6-ND: (GigabitEthernet2.123,FE80::20C:29FF:FEAE:3524) PROBE -> REACH
R01#show ipv6 neighbors
IPv6 Address                              Age Link-layer Addr State Interface
2001:0:0:123::2                             0 000c.29ae.3524  REACH Gi2.123
2001:0:0:123::3                             4 000c.29fe.c0ba  STALE Gi2.123
FE80::20C:29FF:FEAE:3524                    2 000c.29ae.3524  STALE Gi2.123
FE80::20C:29FF:FEFE:C0BA                    4 000c.29fe.c0ba  STALE Gi2.123
Troubleshooting Commands
The other debug command we can use for troubleshooting is the “debug ipv6 packets” command. In the production environment always use access-list based filters to limit the amount of output.
R01
R01#ping 2001:0:0:34::4
Type escape sequence to abort.
Sending 5, 100-byte ICMP Echos to 2001:0:0:34::4, timeout is 2 seconds:
!!!!!
Success rate is 100 percent (5/5), round-trip min/avg/max = 1/1/2 ms
R01#
*Nov 18 00:16:37.609: IPv6-Fwd: Destination lookup for 2001:0:0:34::4 : i/f=GigabitEthernet2.123, nexthop=2001:0:0:123::3
*Nov 18 00:16:37.610: IPv6-Fwd: SAS picked source 2001:0:0:123::1 for 2001:0:0:34::4 (GigabitEthernet2.123)
*Nov 18 00:16:37.610: IPv6-Fwd: nexthop 2001:0:0:123::3,
*Nov 18 00:16:37.610: IPV6: source 2001:0:0:123::1 (local)
*Nov 18 00:16:37.610:       dest 2001:0:0:34::4 (GigabitEthernet2.123)
*Nov 18 00:16:37.610:       traffic class 0, flow 0x0, len 100+0, prot 58, hops 64, originating
*Nov 18 00:16:37.610: IPv6-Fwd: Created tmp mtu cache entry for 2001:0:0:123::1 2001:0:0:34::4 00000000
*Nov 18 00:16:37.610: IPv6-Fwd: L3 injection feature enabled: skipping pak_encap
*Nov 18 00:16:37.611: IPv6-Fwd: Destination lookup for 2001:0:0:123::1 : Local, i/f=GigabitEthernet2.123, nexthop=2001:0:0:123::1
*Nov 18 00:16:37.611: IPV6: source 2001:0:0:34::4 (GigabitEthernet2.123)
*Nov 18 00:16:37.611:       dest 2001:0:0:123::1 (GigabitEthernet2.123)
*Nov 18 00:16:37.611:       traffic class 0, flow 0x0, len 100+18, prot 58, hops 63, forward to ulp
This command produces detailed information on the packet forwarding, including information on which source IPv6 address and the outgoing interface were chosen.
This blog post covers the following CCNA blueprint topics:
1.9 Compare IPv6 address types
1.9.a Global unicast
1.9.b Unique local
1.9.c Link local
1.9.d Anycast
1.9.e Multicast
1.9.f Modified EUI 64
The article content can be useful in preparation for other certification exams and IPv6 gradually becomes as important as IPv4.
Address Format
IPv6 addresses are 128-bit long. An address is divided into 8 groups each containing 4 hexadecimal digits. Groups are separated from each other by colons. Each group is 16-bit long and called hextet.
Hexadecimal digit is called a nibble (4-bit long, half-byte) and can be any number between 0 up to letter F. Figure 1 displays the difference between IPv4 and IPv6 address formats and terms.
Figure 1. IPv4 vs IPv6 Address Format
IPv6 addresses are much longer in size than IPv4 addresses. Zeroes in the address can compress to make it more readable using the following rules:
Leading zeroes within a hextet can be removed. For example, 00FC can be compressed to FC. Using this rule, 0000 can be compressed to 0, as it requires at least a single-digit to be preserved. The IPv6 address from Figure 1 can be compressed to FE80:0:0:0:C4A8:D1BF:7583:1166.
Hextets of all zeroes can be replaced with double-colon once. The address from Figure 1 can be compressed as FE80::C4A8:D1BF:7583:1166. Only one group of zero-hextets can be replaced with double-colon.
IPv6 addresses use prefix notation similar to IPv4 CIDR (Classless Inter-Domain Routing) to identify subnet portion of the address. For example,
2001:C3A9:D1BF:7423:2345:112A:BCDE:F119/64
is part of the subnet:
2001:C3A9:D1BF:7423:0:0:0:0/64
Address Types
There are 3 types of
IPv6 addresses:
Unicast addresses are allocated to a single device. Traffic sent to a unicast address is delivered only to this interface.
Ananycast address can be assigned to many devices at the same time. Traffic sent to an anycast address will be delivered to the closest device.
Multicast. The address associated with multiple hosts and traffic sent to a multicast address delivered to many devices at the same time.
Unicast and anycast use the same IPv6 address space and multicast has its own dedicated prefix range.
In comparison to IPv4, there are no broadcast addresses in IPv6, which used to represent the delivery of traffic to all interfaces. Multicast delivery is now replacing this functionality.
Address Space
IPv6 address space is managed by Internet Assigned Numbers Authority (IANA). Current address space allocation is available via this URL. The special-purpose address registry is available here.
Figure 2. IPv6 Address Space Allocation
Figure 2 demonstrates how address IPv6 address blocks are distributed proportionally to the full address space. Global Unicast address space (2000::/3) is the block that IANA uses for the current allocation and its size should provide enough addresses in the foreseeable future. For example, the entire IPv4 address space would be much smaller than a pixel in Figure 2.
Unicast Address Types
0000::/3
Addresses in 0000::/3 range contain several reserved addresses, such as an unspecified address, loopback, and IPv4-mapped addresses.
Unspecified address, 0:0:0:0:0:0:0:0 or :: means that the address is not present. It cannot be used as a destination address in any packets, however, it is used as a source when a host doesn’t have an address allocated.
Loopback address is allocated address of 0:0:0:0:0:0:0:1/128 or ::1/128. As in IPv4, this address represents the host itself. It cannot be assigned to any of the physical interfaces. As a result, it will not be seen outside of the host, and routers will not forward packets sent to this address.
IPv4-mapped IPv6 addresses are used in Dual-Stack (IPv4/IPv6) systems, so IPv6 application can recognize packet delivered to IPv4 address. For example, packet going to IPv4 address 1.2.3.4 will be mapped to IPv6 address of 0:0:0:0:0:FFFF:1.2.3.4 or ::FFFF:1.2.3.4.
Figure 3 displays the IPv4-mapped IPv6 address format. For all diagrams in this post, black dotted-line annotations mean that the value is static. Yellow dotted-line annotations mean that the value is variable.
Figure 3. IPv4-Mapped Address
IPv4-compatible addresses are another way of encoding IPv4 within IPv6 address. However, they are deprecated and IPv4-mapped addresses should be used instead.
2000::/3
Addresses in 2000::/3 range is what called Global Unicast Address space. The current allocation to registries is listed here.
The format of addresses in this range is shown in Figure 4. Global Unicast Address starts with binary 001 and the first digit can be either 2 or 3.
Figure 4. Global Unicast Address
The first part of the address is variable-length Global Routing Prefix, which can be allocated to a site. It follows by variable-length Subnet ID for allocation within that site. The second half of the address (64-bits) is used by interface ID. Interface ID must be unique on the subnet and are derived from the hardware (MAC) address of the device. The resulting format is called modified EUI-64.
The process of deriving address from MAC address is displayed in Figure 5.
Figure 5. Deriving Modified EUI-64 from MAC Address
E000::/3
The last /3 block is e000::/3. It contains Unique-Local Addresses, Link-Local Unicast Addresses, and Multicast Addresses.
Unique Local Addresses can be used within a site or between multiple sites or organizations. They are not routable on the Internet. They have very similar features as RFC1918 private IPv4 addresses. What makes Unique Local different, is that they are designed to be unique most of the time. Part of the address named Global ID is a 40-bit pseudo-random number that ensures that there is a very small probability of having the same address range as the other party.
Figure 6. Unique Local Address
The allocated range for Unique Local Addresses is FC::/7. However, the 8th bit of the address is a flag. When it has a value of 1 it means that the address is locally defined. This is the only value currently defined, so all addresses will start with FD.
As displayed in Figure 6, Unique Local Address consists of 3 parts: Global ID, Subnet ID, and an Interface ID. A single Global ID prefix can accommodate more than 65000 subnets.
Link-Local IPv6 Unicast Addresses are designed
to be used on a single layer-2 domain. They must not appear as the source or
destination address for packets traversing routers. Link-Local Addresses are
used for local traffic, such as automatic address configuration and neighbor
discovery.
The format of the Link-Local IPv6 Unicast Address is shown in the Figure 7.
Figure 7. Link-Local Address
Multicast Addresses
The multicast address format is shown in Figure 8. The first 8 bits are always 1s (FF). Next 4 bits are reserved for flags followed by 4 bits representing group scope.
Figure 8. Multicast Address
The flag bits (0RPT)
are shown in Figure 9. The first bit (left-most or high-order) is always 0.
R-flag, if set to 1, means Rendezvous Point address is encoded within the group address.
P-flag means that it
is unicast prefix-based allocation. When
an entity receives Unicast Global address allocation, it gets delegated a
corresponding multicast range as well. When P-Flag is set to 1, multicast
address contains encoded unicast prefix of owner-organization.
T-flag stands for transient. If set to 1, the address is non-permanent. If set to 0, the address is well-known and has been permanently assigned by IANA.
Figure 9. IPv6 Address Multicast Address Flags
Scope bits define how far multicast traffic can propagate. Table below shows some of the scopes defined:
Scope bits
Hex
Scope
0001
1
Interface-Local
0010
2
Link-Local
0100
4
Admin-Local
0101
5
Site-Local
1000
8
Organization-Local
1110
E
Global
There are several reserved multicast addresses. The next table shows some of these addresses.
Address
Description
FF02:0000:0000:0000:0000:0000:0000:0001
All Nodes (Link-Local)
FF02:0000:0000:0000:0000:0000:0000:0002
All Routers (Link-Local)
FF02:0000:0000:0000:0000:0001:FFXX:XXXX
Solicited-Node Address (XX:XXXX – last 24 bits of Unicast Address)
FF3S:0000:XXXX:XXXX:XXXX:XXXX:XXXX:XXXX
Source-Specific Multicast (FF3S::/32). S – is scope, X – group address bits
Cisco routers are one of the most widely deployed WAN devices. Traditionally they are individually managed and for the larger networks, administrators require additional tools to monitor, perform configuration backup, and to automate tasks.
Many newer Cisco technologies have some form of a central controller and managed data-plane devices. For example, ACI in the data center and SD-Access for the campus. In WAN space, the Cisco portfolio included IWAN (Intelligent WAN) technology and cloud-managed products from Meraki acquisition. In 2017 Cisco has acquired Viptela and its SD-WAN product line. This post contains an overview of this technology and some basic terminology.
Traditional WAN design
To understand the benefits of SD-WAN, let’s consider how most of the Wide Area Networks are designed. Multiple branch offices connect via an MPLS network to one or two data centers, which also provide centralized Internet access. It is secured by high-performance firewalls, intrusion protection, and web filtering platforms. Each branch or remote office has a single or pair of routers forwarding multiple types of traffic, such as:
Business applications (SAP, ERP)
Office 365 (Outlook, Sharepoint, etc)
Internet browsing
Video and IP telephony
Interactive applications, such as remote desktops
Management and Operational Issues
The device-centric approach has many challenges. For example, application performance troubleshooting requires an administrator to check every router in path hop-by-hop and takes a significant amount of time.
In many WAN environments, quality of service (QoS) configuration is static in nature, as a change in QoS design may take several maintenance windows to deploy across the network.
In a similar way, wireless deployments have transformed from autonomous to controller-based, as many tasks require a coordinated approach in management. For example, Radio Resource Management is one of such tasks, when the channel and transmit power selection is very difficult to maintain manually on every access point.
WAN links are also relatively expensive. In many networks, standby WAN links are required for high availability. Establishing these links takes time and service providers may require fixed-term commitment. In contrast, Internet links are affordable and have shorter lead times to provision.
With traditional design described earlier, traffic going to the workload and applications in a data center has to compete with the services reachable via the public Internet. It is cost-effective to offload Internet traffic to a branch local Internet link.
This interface can also be used as a secondary WAN link connecting sites over VPN connections. However, it is difficult to manage multiple tunnels as the number of routers goes up while providing consistent user experience and ensuring that the security is not compromised.
SD-WAN Design Approach
SD-WAN addresses these issues. A centralized set of controller devices provides a level of abstraction, so network administrators can spend more time on creating policies and configuration templates without having to touch every device on the network.
WAN is treated as a transport-agnostic fabric. Underlay network provides connectivity between tunnel endpoints and doesn’t need to have knowledge about reachability information behind these gateways. As a result, overlay tunnels can be created dynamically and networks can recognize application traffic and select the best path in real-time.
Components and Architecture
SD-WAN operations comprise of 4 planes, implemented by a set of controllers and gateways:
Management plane controller (vManage)
Orchestration plane controller (vBond)
Control plane controller (vSmart)
Data plane forwarding device (vEdge)
Controllers can be hosted and managed by Cisco as a subscription-based product or can be deployed on-premises. vManage, vBond, and vSmart are virtual machines available for download as OVA files. ESXi and KVM are the supported hypervisors.
Figure 1. SD-WAN Architecture
The first component to be configured in a new SD-WAN network is vManage, which can be deployed as a single appliance or cluster of at least 3 nodes. vManage implements a management plane and is the place where all configuration happens. It also performs fabric monitoring and can expose centralized API access for external applications to the SD-WAN network.
vBond is responsible for accepting registration and authenticating vSmart controllers and vEdges. Every device needs to be pointed to vBond during provisioning. It then ensures that all other elements are able to locate each other. vBond must have a public IP address and should be placed into DMZ, so it can be accessed over the Internet.
vSmart controls all overlay routing and secure tunnel establishment between vEdges. The control protocol between vSmart and vEdge elements is called OMP (Overlay Management Protocol). It is protected by DTLS and carries not only reachability information, but also security associations details for IPSec tunnels. vSmart performs policy propagation to the edge devices.
vEdge devices are gateways performing data forwarding over overlay networks. This can be Viptela appliances (vEdge Routers), or Cisco devices running SD-WAN image such as Cisco ISR 4000. There is an option of software vEdge Cloud routers hosted in the public cloud – AWS or Azure.
Cisco works on getting routers with SD-WAN image to have feature parity with Viptela appliances, so always check release notes, as there might be a feature not yet supported on Cisco ISRs.
The next few sections explain the most important terms and concepts of SD-WAN, such as VPNs, TLOCs, and OMP.
Figure 2. SD-WAN Terminology
VPNs
Viptela SD-WAN uses the concept of VPN which is a way to segregate networks. Each VPN has interface allocation and a routing table isolated from other VPNs. It is similar to the Cisco VRF (Virtual Routing and Forwarding) instance. VPN number is globally significant and must match for communication to happen. Encapsulated IP packets carry VPN tag, so egress gateway can determine which VPN packet belongs to.
There are 513 VPNs with the first and last reserved for fabric operations. VPN 0 is transport VPN and is similar to the global VRF context. Interfaces in VPN 0 are called tunnel interfaces and have IP addresses visible by transit networks and form underlay of the fabric. Communication between the network controllers of SD-WAN happens over VPN 0.
VPN 512 is used for Out-Of-Band-Management network.
All other VPNs 1-511 can be used to forward user data.
In Figure 2, VPN 100 and VPN 200 are created in the network. Subnets A, B, and E can communicate with each other within VPN 100. And subnets C and D can communicate with each other within VPN 200.
TLOCs (Transport LOCators)
One of the tasks of OMP is to distribute reachability information. Each destination can be reachable via a specific interface on one of the vEdges on the network. TLOC is a composite structure describing this interface and consists of:
System IP address of the OMP
Color of the link
Encapsulation of the tunnel (IPSec or GRE)
TLOC is similar in concept to the next hop in BGP. Color is a pre-defined tag that describes type of the WAN interface, for example mpls, 3g or biz-internet.
OMP (Overlay Management Protocol)
vSmart exchanges information with vEdges using OMP. This protocol covers all control-plane aspects required to transmit data on top of the overlays.
OMP is responsible for exchange of 3 types of routes:
vRoutes, reachability on the LAN side of the router. vEdge supports static routes, dynamic protocols – BGP and OSPF are supported. Information about a source routing protocol, its metric is carried along with these routes. VPN, the Site ID is another important information present in vRoutes as well.
Service Routes. The way to perform service chaining and insert a firewall or a load balancer
TLOC Routes. Carries information on how to reach specific TLOC such as IP addresses of the interface.